WooCommerce Analytics Dashboard: Complete Guide
Running a WooCommerce store generates thousands of data points every month—from orders and revenue to customer behavior and product performance. The challenge isn't collecting this data; it's understanding it quickly enough to make better business decisions.
This is where a WooCommerce Analytics Dashboard becomes invaluable.
Instead of checking multiple reports separately, an analytics dashboard brings your most important business metrics together in one place. You can monitor revenue, track customer trends, evaluate product performance, and measure overall business health with a single view.
In this guide, you'll learn what a WooCommerce analytics dashboard is, why it matters, the key metrics every store should monitor, and how AI-powered dashboards help businesses grow faster.
Quick Answer
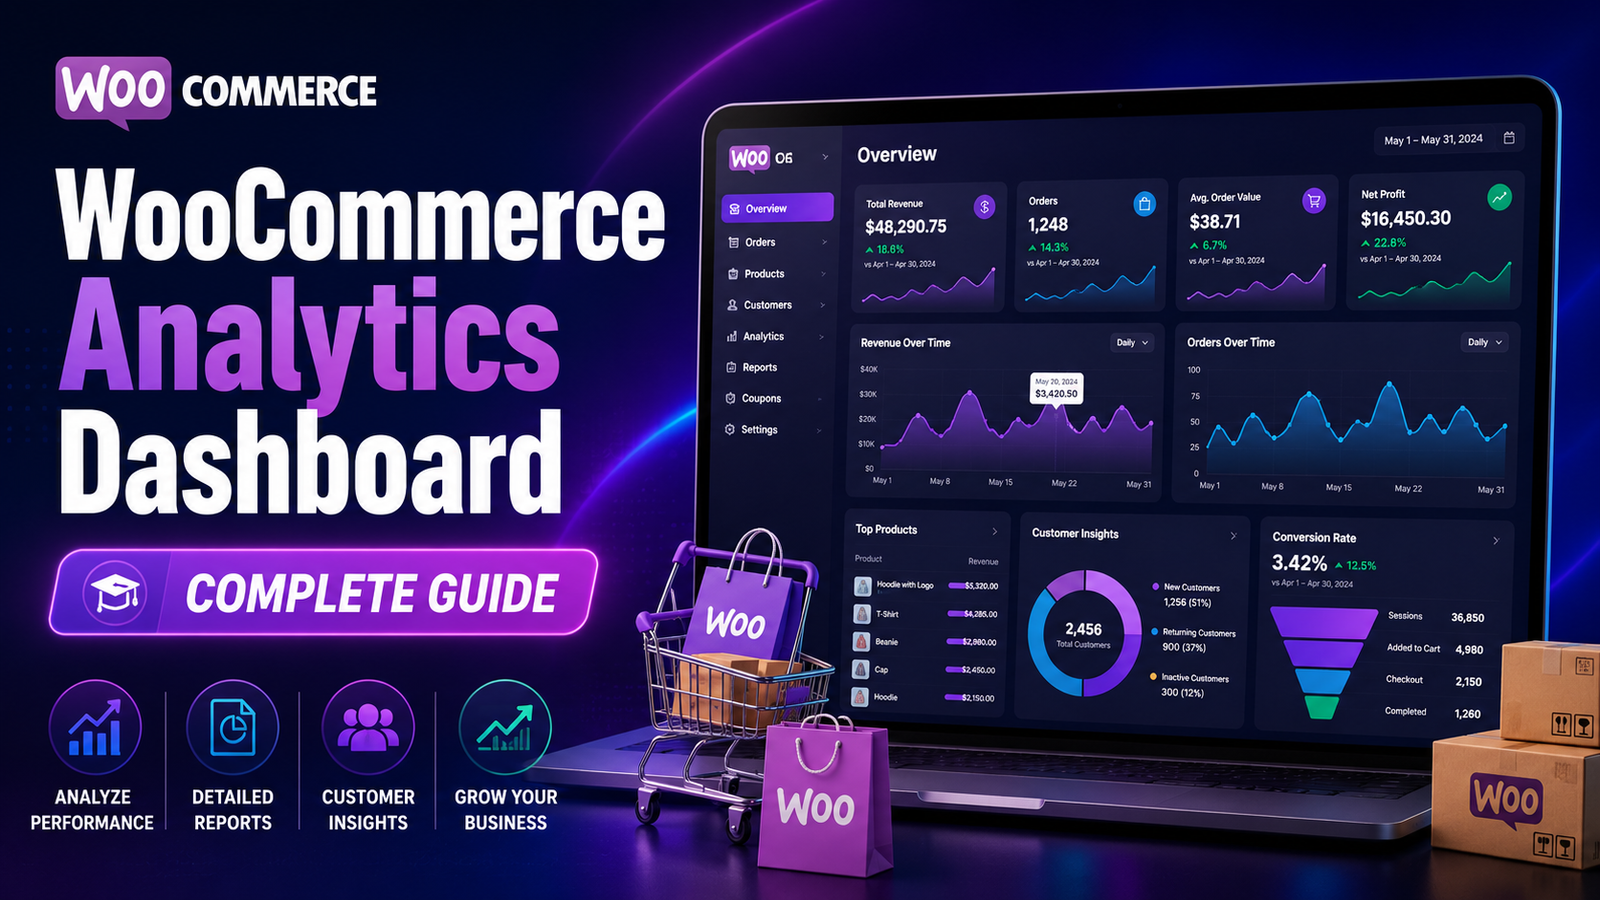
What is a WooCommerce Analytics Dashboard?
A WooCommerce Analytics Dashboard is a centralized reporting interface that displays important business metrics such as revenue, orders, products, customer behavior, conversion trends, and KPIs. It helps store owners monitor performance and make data-driven decisions more efficiently.
Why Every WooCommerce Store Needs an Analytics Dashboard
As your store grows, relying on individual reports becomes inefficient.
A dashboard allows you to:
View business performance instantly
Monitor key metrics in real time
Identify growth opportunities
Detect sales declines early
Track marketing performance
Improve decision-making
Save time by reducing manual reporting
Essential Metrics Every Dashboard Should Include
Revenue Overview
Your dashboard should display:
Daily revenue
Weekly revenue
Monthly revenue
Revenue growth
Average revenue per day
This provides an instant snapshot of business performance.
Orders Dashboard
Track:
Total orders
Completed orders
Pending orders
Cancelled orders
Refunded orders
Order metrics help identify operational trends.
Customer Analytics
Understanding customers is critical for sustainable growth.
Important metrics include:
New customers
Returning customers
Customer Lifetime Value (CLV)
Repeat purchase rate
Purchase frequency
Product Performance
Monitor:
Best-selling products
Lowest-performing products
Revenue by product
Sales by category
Inventory movement
These insights help improve merchandising and inventory planning.
Conversion Metrics
Track:
Conversion rate
Average Order Value (AOV)
Cart abandonment trends
Checkout completion rate
These metrics reveal how efficiently visitors become customers.
Marketing Performance
A comprehensive dashboard should also display:
Organic traffic performance
Paid campaign revenue
Email marketing results
Referral sales
Social media conversions
This helps allocate marketing budgets more effectively.
Benefits of a Centralized Dashboard
Faster Decision-Making
Instead of switching between multiple reports, all critical metrics are available in one location.
Better Visibility
Dashboards help you understand overall business performance at a glance.
Improved Productivity
Automated dashboards reduce manual data collection and reporting.
Smarter Planning
Historical trends and KPIs support forecasting and strategic planning.
Easier Team Collaboration
A shared dashboard allows marketing, sales, and management teams to work with the same data.
Common Dashboard Mistakes
Avoid these common issues:
❌ Displaying too many metrics
❌ Ignoring customer analytics
❌ Reviewing dashboards inconsistently
❌ Tracking vanity metrics instead of KPIs
❌ Failing to compare historical performance
❌ Making decisions without validating trends
A focused dashboard is usually more valuable than an overloaded one.
Best Practices for WooCommerce Dashboards
Focus on Business Goals
Select KPIs that align with your objectives, such as increasing revenue, improving customer retention, or boosting average order value.
Review Dashboards Weekly
Weekly reviews help identify opportunities and address issues before they affect long-term growth.
Compare Time Periods
Evaluate month-over-month and year-over-year performance to identify meaningful trends.
Use AI-Powered Insights
Artificial intelligence can highlight anomalies, predict future sales, and recommend actions based on historical data.
How Kaddora AI Sales Analytics Enhances Your Dashboard
Basic dashboards provide data, but growing businesses often need more context and actionable insights.
Kaddora AI Sales Analytics combines AI-powered analytics with a centralized WooCommerce dashboard to help store owners understand not just what is happening, but also why it matters.
Key Features
Real-time revenue dashboard
AI-powered sales insights
Customer behavior analytics
Product performance tracking
KPI monitoring
Revenue forecasting
Automated reports
Easy-to-read visualizations
WooCommerce integration
Instead of manually analyzing spreadsheets and multiple reports, you get one intelligent dashboard that supports faster, data-driven decisions.
WooCommerce Dashboard Checklist
✅ Revenue Overview
✅ Orders Summary
✅ Customer Insights
✅ Product Performance
✅ Conversion Metrics
✅ Marketing Performance
✅ KPI Dashboard
✅ Historical Comparisons
✅ AI-Powered Insights
Frequently Asked Questions
What is a WooCommerce Analytics Dashboard?
A WooCommerce Analytics Dashboard is a centralized interface that displays sales, revenue, customer, product, and marketing metrics to help store owners monitor business performance.
Which metrics should a dashboard include?
A useful dashboard should track revenue, orders, average order value, customer lifetime value, conversion rate, product performance, and marketing results.
Why is a dashboard better than individual reports?
Dashboards provide a consolidated view of business performance, making it easier to identify trends and make faster decisions.
Can AI improve WooCommerce dashboards?
Yes. AI can analyze data, identify patterns, forecast sales, and provide actionable recommendations beyond standard reports.
Which WooCommerce dashboard solution is suitable for growing businesses?
Businesses looking for AI-powered dashboards, revenue insights, customer analytics, KPI monitoring, and forecasting can benefit from Kaddora AI Sales Analytics.
Final Thoughts
A well-designed WooCommerce analytics dashboard is more than a reporting tool—it's a decision-making platform.
By monitoring the right KPIs, reviewing trends consistently, and using AI-powered insights, you can improve operational efficiency, identify growth opportunities, and build a more profitable online store.
If you're ready to move beyond basic dashboards, Kaddora AI Sales Analytics provides intelligent reporting, real-time visibility, and actionable business insights to help your WooCommerce store grow with confidence.
Comments (0)