
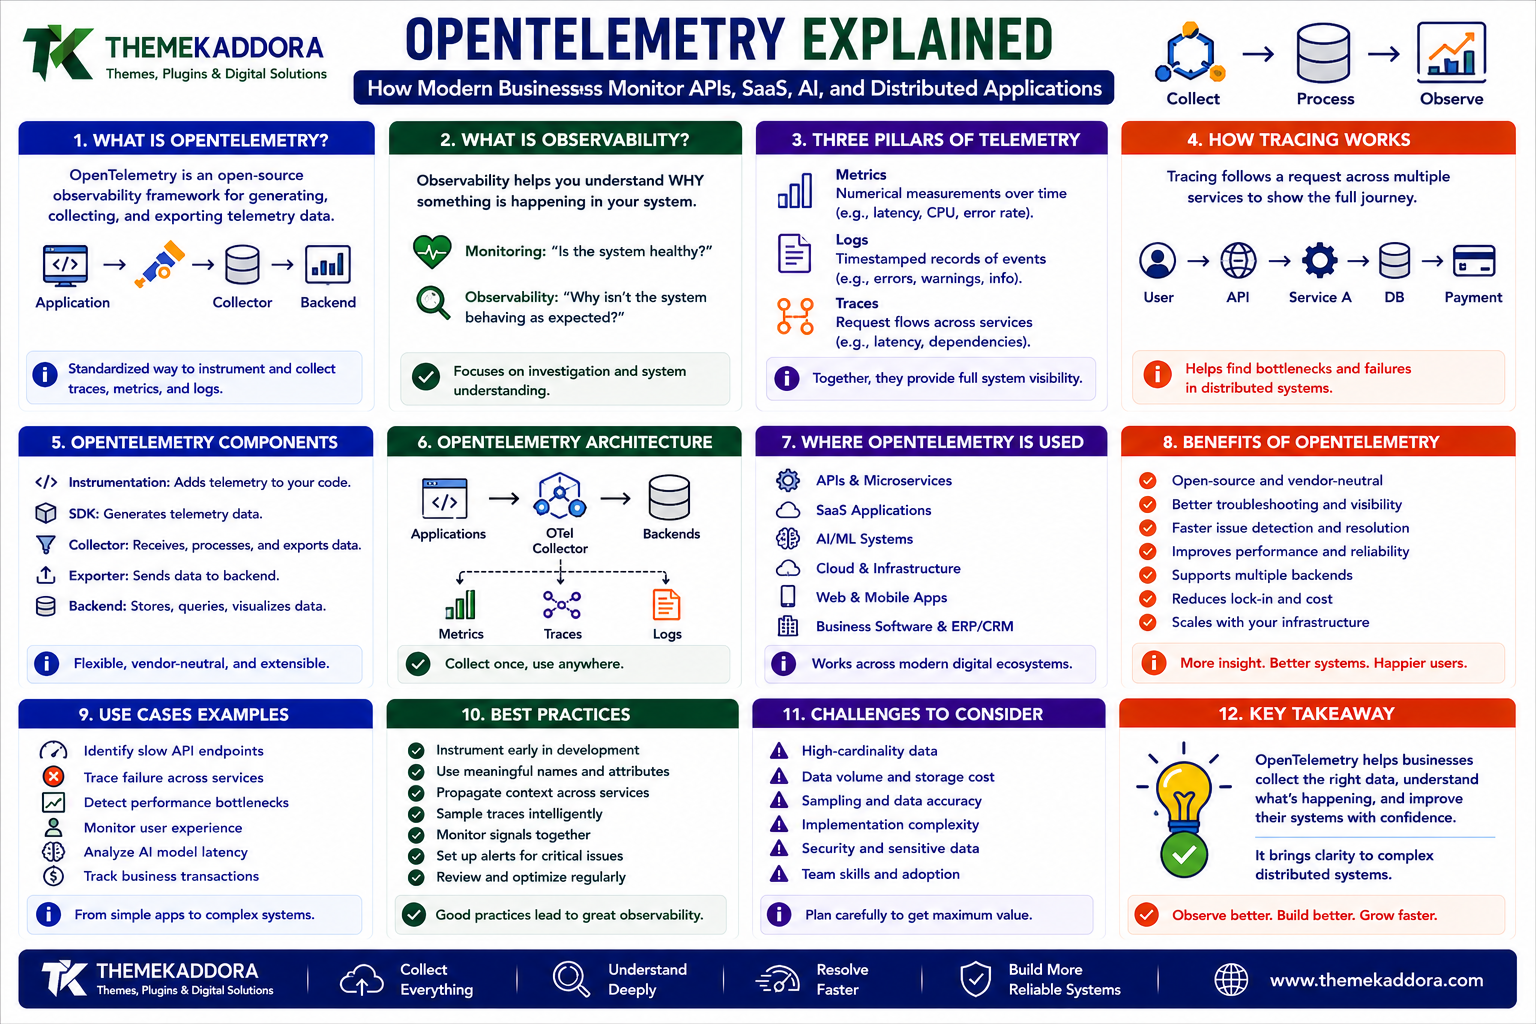
OpenTelemetry Explained: How Modern Businesses Monitor APIs, SaaS, AI, and Distributed Applications
Introduction
Modern software systems are becoming increasingly interconnected.
A single customer action may trigger:
Browser ↓ Frontend ↓ API ↓ Authentication ↓ CRM ↓ ERP ↓ Database ↓ Payment Service ↓ Email ↓ Analytics
When everything works, the architecture may appear simple to users.
But when something fails, the problem can become difficult to find.
A customer might report:
"Checkout is slow."
But where is the delay?
Is it:
The browser?
The API?
Authentication?
Database?
Payment provider?
Inventory service?
Network?
External API?
A background job?
Traditional monitoring may tell you:
Server CPU: 48% Memory: Normal Website: Online
Everything appears healthy.
Yet customers are experiencing slow transactions.
This is why observability has become increasingly important.
Observability helps teams understand what is happening inside a system by collecting and connecting information such as:
Logs
Metrics
Traces
OpenTelemetry is an open-source observability framework and ecosystem designed to help applications generate, collect, and export telemetry data.
A simplified architecture looks like:
Application ├── Logs ├── Metrics └── Traces ↓ OpenTelemetry ↓ Collector ↓ Observability Platform ↓ Dashboards + Alerts + Investigation
The goal is not simply to collect more data.
The goal is to answer questions such as:
What happened?
Where did it happen?
Why did it happen?
Which users were affected?
How long did it take?
Which service caused the problem?
In this guide, you'll learn what OpenTelemetry is, what observability means, how traces, metrics, and logs work together, how distributed tracing follows a request through multiple services, how the OpenTelemetry Collector works, how to monitor APIs, SaaS applications, AI workflows, and business systems, and how to build a practical observability strategy.
1. What Is OpenTelemetry?
OpenTelemetry is an open-source observability framework and set of tools for generating, collecting, and exporting telemetry data.
Telemetry commonly includes:
Traces Metrics Logs
OpenTelemetry is designed to provide a standardized approach to instrumentation and telemetry collection.
Instead of building every application around one monitoring vendor's proprietary instrumentation, teams can use OpenTelemetry-compatible instrumentation and send telemetry to supported backends.
A simplified model is:
Application ↓ OpenTelemetry Instrumentation ↓ Telemetry ↓ Collector / Exporter ↓ Observability Backend
2. What Is Observability?
Observability is the ability to understand the internal state and behavior of a system using the information it produces.
Monitoring often asks:
"Is the system healthy?"
Observability helps investigate:
"Why isn't the system behaving as expected?"
For example:
Monitoring: Error Rate = 5% Observability: Which endpoint? Which service? Which customer? Which deployment? Which database query? Which external dependency?
Observability therefore emphasizes investigation and system understanding.
3. The Three Pillars of Telemetry
A common observability model uses:
Metrics
Numerical measurements over time.
Examples:
CPU Usage Request Rate Error Rate Latency Memory
Logs
Timestamped records describing events.
Payment processing failed. Order ID: 1024 Provider response: timeout
Traces
Information showing how a request travels through a distributed system.
Request ↓ API ↓ Database ↓ Payment ↓ Email
These signals become much more useful when they can be correlated.
4. What Are Metrics?
Metrics are numerical values collected over time.
Common application metrics include:
Request count
Error count
Response latency
CPU utilization
Memory usage
Queue depth
Database connections
For example:
API Requests: 12,400/min Errors: 120/min Average Latency: 280 ms
Metrics are excellent for dashboards and alerting.
5. What Are Logs?
Logs record events that happen inside an application.
For example:
2026-08-13 18:30:12 PaymentService Payment provider timeout
Useful logs can include:
Event
Timestamp
Severity
Service
Request ID
Error information
Relevant context
Avoid logging sensitive secrets or unnecessary personal information.
6. What Are Traces?
A trace represents the journey of a request through a distributed system.
For example:
Trace ├── Frontend ├── API ├── Auth ├── Database ├── Payment └── Email
Instead of seeing six independent operations, a trace connects them into one request flow.
This can make distributed troubleshooting much easier.
7. What Is a Span?
A trace is made up of smaller units called spans.
For example:
Trace: Checkout Span ├── API Request ├── Database Query ├── Payment Request └── Inventory Update
Each span can contain information such as:
Start time
Duration
Operation
Service
Status
Attributes
Related events
The trace connects the spans into a larger transaction.
8. Distributed Tracing
Distributed tracing becomes especially useful when one user action crosses multiple services.
For example:
Checkout Request ↓ Order Service ↓ Inventory Service ↓ Payment Service ↓ Notification Service
Suppose the entire request takes 4 seconds.
Tracing may reveal:
Order Service 200 ms Inventory Service 300 ms Payment Service 3,200 ms Notification 300 ms
The bottleneck becomes much easier to identify.
9. Trace Context
For distributed tracing to work, context needs to travel between services.
Conceptually:
Service A ↓ Trace Context ↓ Service B ↓ Trace Context ↓ Service C
This allows multiple services to associate their operations with the same overall request.
Without context propagation, distributed traces can become disconnected fragments.
10. Why Trace IDs Matter
A trace identifier can connect multiple operations.
For example:
Trace ID: abc123 API Span Database Span Payment Span Email Span
When a user reports a problem, support or engineering teams can potentially use a request or trace identifier to investigate the full journey.
This is especially useful for customer-facing applications.
11. Metrics and Traces Work Together
Consider an API dashboard showing:
Latency: 900 ms Error Rate: 2.4%
Metrics show the problem.
Tracing helps investigate it.
The workflow becomes:
Metric Alert ↓ Find Affected Endpoint ↓ Open Trace ↓ Identify Slow Span ↓ Investigate Service
This connection between high-level monitoring and detailed investigation is one of the strengths of observability.
12. Logs and Traces Work Together
A trace may identify a failed payment span.
The corresponding logs may reveal:
Payment provider timeout Retry attempt 2 Timeout after 5 seconds
If logs are associated with trace context, engineers can move from:
Trace ↓ Span ↓ Related Logs ↓ Root Cause
This can significantly reduce debugging time.
13. What Is the OpenTelemetry SDK?
OpenTelemetry provides libraries and tooling that allow applications to generate telemetry.
Developers can instrument applications using supported language ecosystems.
The application may generate:
Metrics Logs Traces
and pass them to an OpenTelemetry pipeline.
The exact setup depends on the programming language and deployment architecture.
14. Automatic vs Manual Instrumentation
There are generally two approaches.
Automatic Instrumentation
Libraries or agents capture telemetry for common frameworks and operations.
This can reduce development effort.
Manual Instrumentation
Developers explicitly create spans or metrics around important business operations.
For example:
Process Order ↓ Create Span ↓ Business Logic ↓ End Span
Manual instrumentation is useful for domain-specific operations that generic instrumentation cannot understand.
15. Business-Level Observability
Infrastructure telemetry is useful, but businesses also need to observe important business operations.
For example:
Technical: API latency = 200 ms Business: Checkout completion = 96%
An application can be technically healthy while business performance is declining.
Business-level telemetry can include:
Orders
Successful payments
Failed checkouts
Customer signups
Subscription renewals
Support resolution
Inventory processing
Observability should connect technical behavior to business outcomes.
16. API Observability
APIs are a strong use case for OpenTelemetry.
Useful signals include:
Request Count Error Rate Latency Endpoint HTTP Status Client Trace ID
For example:
POST /orders Requests: 4,820/min Errors: 1.2% P95: 480 ms
A trace can then show why individual requests are slow.
17. SaaS Observability
SaaS platforms often contain many interconnected services.
For example:
Frontend ↓ API Gateway ↓ Authentication ↓ Application ↓ Database ↓ External Services
Observability can help SaaS teams monitor:
Signup
Login
Subscription
Billing
Feature usage
API requests
Background jobs
Database performance
This becomes increasingly important as the product grows.
18. Observability for AI Applications
AI systems can have unusual request flows.
For example:
User Request ↓ AI Model ↓ Tool Call ↓ Search ↓ CRM ↓ ERP ↓ AI Reasoning ↓ Response
A single user request may involve many operations.
Tracing can help answer:
Which AI request was slow?
Which tool call failed?
How many model calls occurred?
Which external API caused latency?
Where did the workflow stop?
AI systems therefore benefit from observability just like traditional applications.
19. AI Agent Observability
AI agents are particularly important to monitor because they may perform multi-step workflows.
For example:
Agent Task ↓ Search ↓ CRM ↓ ERP ↓ Email
Observability can track:
Agent execution time
Tool calls
Retry count
Model calls
Token usage
Errors
Human interventions
Final outcome
This makes autonomous workflows easier to control.
20. Monitoring AI Costs
AI applications may have variable operating costs.
A single task might involve:
3 Model Calls + 4 Tool Calls + 2 Search Requests
Observability can help measure:
Tokens
Model usage
Tool calls
Cost per workflow
Failed attempts
Latency
This can reveal expensive workflows that need optimization.
21. OpenTelemetry Collector
The OpenTelemetry Collector can receive, process, and export telemetry.
A simplified architecture is:
Applications ├── Service A ├── Service B └── Service C ↓ OpenTelemetry Collector ↓ Processors ↓ Exporters ↓ Observability Backend
The Collector can provide a central location for telemetry processing.
22. Why Use a Collector?
A collector can help centralize:
Processing
Routing
Filtering
Transformation
Export
Buffering
This can separate application instrumentation from the final monitoring backend.
For example:
Application ↓ OpenTelemetry ↓ Collector ↓ Backend A
Later:
Application ↓ OpenTelemetry ↓ Collector ↓ Backend B
The application instrumentation may not need to change dramatically.
23. Telemetry Processing
A collector can process telemetry before export.
Potential operations include:
Filtering
Sampling
Enrichment
Routing
Batching
Transformation
For example:
Incoming Telemetry ↓ Remove Unnecessary Data ↓ Add Environment Metadata ↓ Batch ↓ Export
This can help control volume and cost.
24. Trace Sampling
Large applications can generate enormous numbers of traces.
Collecting every single trace may be expensive.
Sampling can reduce the amount of data stored.
For example:
1,000,000 Requests ↓ Sampling ↓ 100,000 Traces
However, important traces may need special treatment.
For example:
Errors → Always Retain Normal Requests → Sample
Sampling strategy should be based on the application's investigation needs.
25. High-Cardinality Data
Observability systems need to handle attributes carefully.
For example:
user_id request_id order_id
These values can have enormous numbers of unique combinations.
High-cardinality data can increase storage and query costs.
Use business identifiers when they provide real debugging value, but avoid adding unlimited dimensions without considering the operational impact.
26. Observability and Privacy
Telemetry can accidentally contain personal information.
For example:
Email Phone Customer ID Order Details
Developers should decide:
What data is necessary
What data can be masked
What data should never be logged
How long telemetry is retained
Who can access it
Never send passwords, API secrets, or payment credentials into logs or traces.
27. Observability and Security
Observability systems themselves become sensitive infrastructure.
They may contain:
Application behavior
Customer information
Internal URLs
Error details
Business events
Infrastructure information
Protect them using:
Access control
Authentication
Encryption
Retention policies
Audit logs
A monitoring platform should not become an accidental data-exposure source.
28. Alerting
Monitoring becomes useful when it can alert teams about important conditions.
Examples include:
Error Rate > Threshold Latency > Threshold Queue Depth > Threshold Payment Failures > Threshold
But alerting should be carefully designed.
Too many alerts create:
Alert fatigue.
The goal is to alert people about situations that require investigation or action.
29. SLOs and SLIs
Organizations can define service reliability goals.
An SLI is a measurement of service performance.
Examples:
Availability
Latency
Error rate
An SLO defines the target.
For example:
SLO: 99.9% Successful Requests
Observability data can help teams measure whether the application meets these objectives.
30. Error Budgets
An error budget represents how much unreliability can be tolerated while still meeting an SLO.
For example:
SLO: 99.9% Allowed Failure: 0.1%
Observability provides the measurements required to track this.
This can help engineering teams balance:
Reliability
Feature development
Release speed
31. Observability and Deployments
A new deployment can introduce problems.
For example:
Deployment ↓ Latency Increases ↓ Error Rate Increases
Observability allows teams to compare:
Before Deployment vs After Deployment
This can help identify regressions quickly.
32. Observability for Background Jobs
Not all important work happens during HTTP requests.
Applications may have:
Queues
Workers
Cron jobs
Scheduled tasks
Data pipelines
Observability can monitor:
Queue ↓ Worker ↓ Job ↓ External API
Useful metrics include:
Queue depth
Processing time
Failure rate
Retry count
Job throughput
33. Observability for Event-Driven Systems
Event-driven architectures can be difficult to debug.
For example:
OrderCreated ↓ Payment ↓ Inventory ↓ Email ↓ Analytics
A trace or correlation identifier can connect these operations.
This makes it easier to investigate:
Where did the event workflow fail?
34. Observability for Data Pipelines
Data pipelines also require monitoring.
Useful metrics include:
Records processed
Failed records
Processing latency
API failures
Data freshness
Queue depth
For example:
ETL Job ↓ Records: 2.4M Failed: 124 Duration: 18 min Freshness: 6 min
This helps data teams detect issues before dashboards become inaccurate.
35. Observability and Customer Experience
Technical metrics are useful, but businesses should connect them to user outcomes.
For example:
API Latency ↑ ↓ Checkout Time ↑ ↓ Conversion ↓
Observability becomes more valuable when teams can connect infrastructure behavior to business impact.
36. Observability for Payments
Payment flows deserve special attention.
For example:
Checkout ↓ Payment Request ↓ Provider ↓ Confirmation ↓ Order
Teams can monitor:
Payment latency
Failure rate
Provider errors
Retry counts
Successful transactions
Do not log sensitive payment credentials or secret values.
37. Observability for CRM and ERP Integrations
Business integrations often depend on multiple APIs.
For example:
Order ↓ ERP ↓ CRM ↓ Email
A trace can reveal:
ERP: 120 ms CRM: 80 ms Email: 2,400 ms
The slow integration becomes immediately visible.
This can make troubleshooting much faster than checking each system individually.
38. Observability and Infrastructure
Application telemetry should be considered alongside infrastructure monitoring.
Useful infrastructure signals include:
CPU
Memory
Disk
Network
Containers
Database
Cache
Queue
The goal is:
User Experience + Application + Infrastructure
rather than looking at only one layer.
39. Common Observability Mistakes
Avoid these problems:
Collecting Everything
More telemetry is not automatically better.
No Correlation IDs
Distributed investigations become difficult.
Logging Sensitive Data
Telemetry can become a privacy and security risk.
No Alert Prioritization
Teams become overwhelmed.
No Business Context
Technical dashboards may not explain customer impact.
No Sampling Strategy
Large systems can generate excessive telemetry costs.
Monitoring Without Action
Alerts are useless if no one knows what to do next.
40. OpenTelemetry Best Practices
A strong observability strategy should:
Instrument important application boundaries.
Collect metrics, logs, and traces appropriately.
Propagate trace context across services.
Use correlation identifiers.
Protect sensitive telemetry.
Apply sampling where appropriate.
Monitor critical business workflows.
Define useful alerts.
Track service objectives.
Monitor queues and background jobs.
Connect technical signals to business outcomes.
Review telemetry costs regularly.
Observability should help teams understand the system, not simply generate more dashboards.
41. A Practical OpenTelemetry Implementation Workflow
A business can start with:
1. Identify Critical User Journeys ↓ 2. Identify Important Services ↓ 3. Instrument Applications ↓ 4. Collect Traces / Metrics / Logs ↓ 5. Configure Collector ↓ 6. Connect Backend ↓ 7. Create Dashboards ↓ 8. Define Alerts ↓ 9. Test Failure Scenarios ↓ 10. Measure Improvement
Start with a few high-value workflows rather than instrumenting everything at once.
Why Choose ThemeKaddora?
At ThemeKaddora, we believe modern digital products should be observable as they scale.
A business technology ecosystem may include:
SaaS applications
APIs
ERP
CRM
AI
eCommerce
Data pipelines
Event-driven systems
Cloud infrastructure
As these components multiply, understanding how a request moves through the system becomes increasingly important.
Observability can help teams move from:
"Something is slow."
to:
"The payment-provider integration added 2.4 seconds to this checkout workflow."
ThemeKaddora focuses on practical digital products and technology solutions built around:
Reliability
Performance
Security
Integration
Scalability
Maintainability
Conclusion
OpenTelemetry and modern observability practices help businesses understand complex applications by connecting:
Metrics + Logs + Traces
Traditional monitoring can tell you that something is wrong.
Observability helps investigate:
What happened → Where → Why → Who was affected → What should happen next
For APIs, SaaS platforms, AI applications, ERP integrations, eCommerce, event-driven systems, and data pipelines, this visibility becomes increasingly valuable.
The strongest observability architecture does not collect unlimited data.
It collects the right signals, connects them together, protects sensitive information, and makes important problems easier to investigate.
The goal is not to create more dashboards. The goal is to shorten the distance between a production problem and the person who needs to understand and fix it.
Frequently Asked Questions
1. What is OpenTelemetry?
OpenTelemetry is an open-source observability framework and ecosystem for generating, collecting, and exporting telemetry such as traces, metrics, and logs.
2. What is observability?
Observability is the ability to understand a system's internal behavior and state using the information the system produces.
3. What is distributed tracing?
Distributed tracing follows a request as it travels through multiple services, making it easier to identify latency and failure points.
4. What is a span?
A span is an individual operation within a trace, such as a database query, API call, or service operation.
5. What does the OpenTelemetry Collector do?
The Collector can receive, process, filter, batch, route, and export telemetry from applications and infrastructure.
6. Do AI applications need observability?
Yes. AI workflows can involve model calls, tool calls, APIs, databases, and multiple processing steps, making observability valuable for reliability and cost management.
7. Can observability include business metrics?
Yes. Businesses can monitor operational metrics such as orders, successful payments, signups, checkout completion, and other important outcomes alongside technical metrics.
8. Should logs contain customer information?
Only when genuinely necessary and with appropriate protection. Sensitive information should generally be minimized or excluded from telemetry.
9. What is the difference between monitoring and observability?
Monitoring typically focuses on known conditions and whether systems are healthy. Observability provides deeper information that helps investigate unexpected behavior and root causes.
10. Why choose Themekaddora?
Themekaddora provides lightweight, responsive, SEO-friendly WordPress themes with fast performance, WooCommerce compatibility, flexible customization, accessibility-conscious design, modern templates, regular updates, and professional support—providing a strong foundation for businesses building digital products and product-focused websites.
Comments (0)