
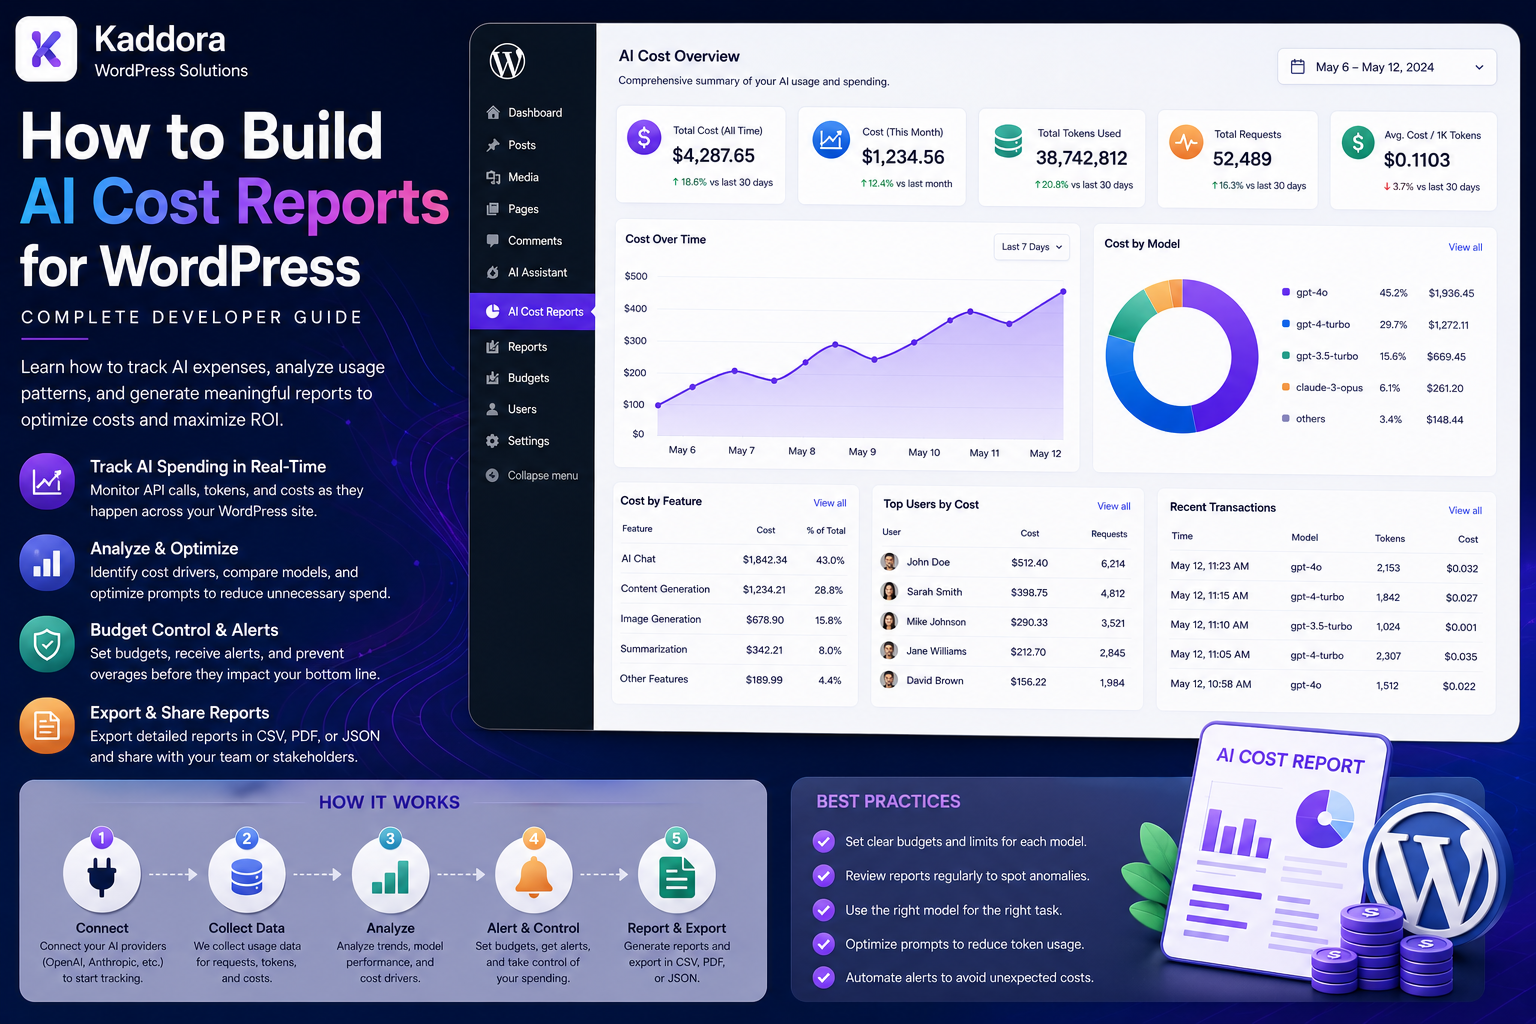
How to Build AI Cost Reports for WordPress: Complete Developer Guide
Introduction
AI-powered WordPress plugins can create powerful features, but AI usage introduces a variable infrastructure cost.
A plugin may use AI for:
Content Generation SEO Analysis Document Extraction Chatbots Moderation Recommendations Lead Scoring RAG Semantic Search
As usage grows, simply knowing how many requests were made is not enough.
A production system needs to understand:
How Much AI Was Used? Which Model Was Used? Which Provider Was Used? Which Feature Consumed It? Which User Generated It? Which Tenant Paid for It? How Much Did It Cost? How Much Was Saved Through Caching?
For example:
Total Requests: 100,000 Input Usage: 80M Output Usage: 20M Estimated Provider Cost: ₹75,000
That information can then be broken down by:
User Tenant Site Feature Model Provider Date Plan
A mature WordPress AI cost-reporting architecture can look like:
AI Request ↓ Provider Response ↓ Usage Normalization ↓ Usage Event ↓ Pricing Resolver ↓ Cost Calculation ↓ Aggregation ↓ Dashboard / Export
The key principle is:
AI cost reporting should separate raw provider usage, pricing rules, customer credits, and business revenue so each layer can be measured independently and reconciled accurately.
What Is an AI Cost Report?
An AI cost report shows how much AI infrastructure was consumed and what that usage cost.
A report may contain:
Requests Input Tokens Output Tokens Total Tokens Model Provider Estimated Cost Actual Cost Credits Feature Tenant User Date
Why Build AI Cost Reports?
AI cost reports help businesses:
Control infrastructure spending
Identify expensive features
Understand customer usage
Set profitable subscription plans
Detect abnormal usage
Compare models
Compare providers
Forecast future spending
Reconcile provider invoices
Optimize AI architecture
AI Cost vs Customer Charges
These are not necessarily the same.
For example:
Provider Cost: ₹20 Customer Credit Usage: 100 Credits Customer Subscription: ₹999
These represent different accounting layers.
Four Important Accounting Layers
A useful architecture separates:
Provider Usage ↓ Provider Cost ↓ Customer AI Credits ↓ Customer Revenue
This allows proper unit-economic analysis.
Provider Usage
Provider usage may contain:
Input Tokens Output Tokens Cached Usage Requests Other Billable Units
The exact categories depend on the provider.
Provider Cost
Provider cost converts usage into money using the pricing that applied to the request.
Customer Credits
Credits are the product's internal usage unit.
For example:
20 Credits
may represent:
₹5
of expected infrastructure consumption.
The mapping is a product decision.
Revenue
Revenue comes from:
Subscription Credit Purchases Usage Overage Enterprise Contracts
Revenue should not be confused with provider cost.
Track Usage at Request Level
A useful event might include:
Job ID Request ID User ID Tenant ID Site ID Feature Task Provider Model Input Usage Output Usage Total Usage Credits Cost Status Timestamp
Why Job IDs Matter
One logical operation may create:
Initial Request Retry Fallback
A job ID ties those provider attempts to one logical task.
Why Request IDs Matter
A provider may return its own request identifier.
Store it when available for troubleshooting and reconciliation.
Track Attempts Separately
For:
Job: 123
you may have:
Attempt 1: Model A Attempt 2: Model A Attempt 3: Model B
Each attempt can have its own usage and cost.
Logical Cost vs Provider Cost
A single customer-facing task may create multiple provider operations.
Therefore track:
Logical Task Cost
and:
Provider Operation Cost
separately.
Usage Normalization
Different providers may use different field names.
Normalize them to:
input_usage output_usage total_usage cached_usage
where applicable.
Provider Adapter
A provider adapter can convert each response into your internal usage format.
For example:
interface AI_Usage_Adapter { public function normalize( array $response ): array; }
The rest of the reporting system no longer needs provider-specific field names.
Pricing Registry
Store pricing separately from usage.
A pricing record can include:
Provider Model Input Rate Output Rate Cached Rate Currency Effective From Effective To Version
Why Pricing Version Matters
Suppose a model's price changes.
Old requests should not suddenly appear more expensive because the report is using today's rate.
Historical usage should use the pricing context that applied when the usage occurred.
Cost Calculation
A conceptual calculation can be:
Input Cost = Input Usage × Input Rate
and:
Output Cost = Output Usage × Output Rate
Then:
Total Cost = Input Cost + Output Cost
Additional provider-specific charges may need to be included where applicable.
Estimated vs Actual Cost
Before execution:
Estimated: ₹10
After execution:
Actual: ₹8.70
Keep estimates and actuals separate.
Why Estimates Matter
Estimates help with:
Quota Checks Budget Reservations Batch Planning User Warnings
Actual usage supports final reporting.
Cost Report Dimensions
Reports can be grouped by:
Date User Tenant Site Feature Task Model Provider Plan Status
Daily Cost Report
Example:
Date: August 28 Requests: 5,000 Provider Cost: ₹4,200
This helps identify daily spending trends.
Monthly Cost Report
Example:
Month: August Requests: 150,000 Tokens: 120M Cost: ₹92,000
Cost by Feature
For example:
SEO AI: ₹10,000 Chat: ₹45,000 Document AI: ₹30,000 Moderation: ₹7,000
This immediately shows where optimization matters most.
Cost by Model
Example:
Model A: ₹15,000 Model B: ₹55,000 Model C: ₹22,000
Cost by Provider
For a multi-provider system:
Provider A: ₹40,000 Provider B: ₹35,000 Provider C: ₹17,000
Cost by Tenant
A SaaS platform may show:
Tenant A: ₹2,000 Tenant B: ₹8,000 Tenant C: ₹25,000
This supports customer-level cost attribution.
Cost by User
A tenant administrator might see:
User A: ₹500 User B: ₹2,000 User C: ₹750
subject to the product's permissions and privacy model.
Cost by Plan
A SaaS product can compare:
Basic: Revenue ₹20K AI Cost ₹5K Pro: Revenue ₹100K AI Cost ₹35K
This supports plan profitability analysis.
Cost Per Feature Action
Measure:
Feature Cost ÷ Feature Actions
For example:
SEO Analysis Cost: ₹5,000 Actions: 10,000 Cost per Action: ₹0.50
Cost Per Successful Task
A better metric may be:
Total AI Cost ÷ Successful Tasks
This includes:
Retries Fallbacks Failures
Cost Per Customer
For SaaS:
AI Cost ÷ Active Paying Tenants
This can support pricing analysis.
Gross AI Margin
A simple calculation is:
AI Revenue − AI Provider Cost = Gross AI Contribution
Do not treat this as full business profit because other costs remain.
AI Cost Dashboard
A useful dashboard can show:
Total Requests Total Tokens Provider Cost Customer Credits Cache Hits Retries Fallbacks
Cost Trend Chart
Show:
Daily Cost
over:
7 Days 30 Days 90 Days
This helps identify sudden spending changes.
Usage Trend Chart
Track:
Daily Requests Daily Tokens
alongside cost.
Cost Forecasting
A simple estimate might use:
Current Daily Average × Remaining Days
For example:
Average: ₹3,000/day Projected 30-Day: ₹90,000
Forecasts are estimates rather than guarantees.
Better Forecasting
A more robust forecast can consider:
Trend Seasonality Tenant Growth Feature Adoption Plan Mix Model Changes
Budget Monitoring
Suppose:
Monthly Budget: ₹100,000 Current: ₹85,000
the platform can display:
85% Used
Cost Alerts
Trigger alerts at:
50% 75% 90% 100%
or another business-defined threshold.
Feature-Level Budgets
For example:
Document AI: ₹20,000 Chat: ₹40,000 SEO: ₹10,000
This prevents one feature from consuming the entire budget.
Tenant-Level Budgets
A SaaS tenant can have:
Budget: ₹10,000/month
and receive alerts when usage approaches the threshold.
User-Level Budgets
A tenant can optionally assign:
User A: ₹500/month User B: ₹1,000/month
Cost by Input Usage
High input cost can indicate:
Large Prompts Large RAG Context Long Conversations
This creates optimization opportunities.
Cost by Output Usage
High output cost may indicate:
Overly Long Responses Poor Output Limits Unnecessary Explanations
Context Cost Analysis
For RAG, break out:
Question Tokens + Retrieved Context + Instructions
This shows whether retrieval is creating excessive input usage.
Cost of Conversation History
AI chatbots can become more expensive as history grows.
Track:
Average Input Usage per Message
over the conversation length.
Optimize Conversation Costs
Possible strategies include:
History Summaries Relevant History Only Context Limits Caching
Test quality before deploying these changes broadly.
Cost of Embeddings
RAG systems may have separate embedding costs.
Track:
Embedding Requests Embedding Usage Embedding Cost
separately from generation.
Cost of Document Processing
Document workflows may include:
OCR Extraction Embedding Generation
Track each stage when usage data is available.
Cost of Retries
A cost report should show:
Primary Cost Retry Cost Fallback Cost
because retries can materially affect unit economics.
Cost of Fallback Models
Track fallback usage separately:
Primary: ₹40K Fallback: ₹5K
A high fallback share may indicate reliability issues.
Cost of Cache Misses
A cache report can show:
Cache Hits: 70% Cache Misses: 30%
and estimate the provider calls avoided.
Estimated Cost Avoided
Conceptually:
Avoided Requests × Average Equivalent Cost = Estimated Cost Avoided
Keep this clearly labeled as an estimate.
Cache Savings Report
Example:
Provider Requests Avoided: 50,000 Estimated Usage Avoided: 10M Tokens Estimated Cost Avoided: ₹8,000
AI Cost by Subscription
For each plan:
Plan Revenue AI Cost AI Margin
This can reveal plans that are underpriced relative to usage.
Unit Economics
A useful report may include:
Revenue / Tenant AI Cost / Tenant Gross AI Margin / Tenant
Plan Profitability
For example:
Basic: Revenue: ₹499 AI Cost: ₹300 Contribution: ₹199
Actual profitability requires considering other business costs.
Customer Segmentation by Cost
Identify:
Low Usage Medium Usage High Usage Extreme Usage
This can support plan design and customer success.
Cost Anomaly Detection
Suppose normal usage is:
₹1,000/day
but today:
₹10,000
Flag the spike.
Possible Causes of Cost Spikes
Investigate:
New Feature Bug Bot Traffic Large Batch Retry Loop Provider Pricing Change Model Change Tenant Growth
Cost by Request Status
Separate:
Successful Failed Retried Cancelled
Failures can still create provider costs.
Failed Request Cost
A failed request may have consumed provider resources.
Therefore:
Status: Failed Usage: 10K Tokens Cost: ₹X
can be a valid report entry.
Cost by HTTP / Provider Error
Track categories such as:
Timeout Rate Limit 5xx Authentication Invalid Request
This can show where cost is lost to failures.
Cost and Model Selection
Compare:
Model A Quality: 90 Cost: ₹10K Model B Quality: 92 Cost: ₹35K
If the quality difference does not justify the cost, routing may be changed.
Cost per Quality Outcome
For generated content, compare:
Cost + Human Acceptance
instead of cost alone.
Cost per Valid Structured Result
For JSON workflows:
Total Cost ÷ Valid Results
This includes schema failures and retries.
Cost per Successful RAG Answer
For RAG:
Generation Cost + Retrieval-Related AI Cost
can be compared to:
Successful Answers
Cost Report Data Warehouse
At larger scale, reporting can use:
Raw Usage Events ↓ Daily Aggregates ↓ Monthly Aggregates ↓ Analytics
Raw Usage Events
Store detailed records for:
Audit Reconciliation Debugging
Daily Aggregates
Example:
Date Tenant Feature Model Input Output Cost
Monthly Aggregates
Use for:
Billing Plan Analytics Profitability Forecasting
Indexing Cost Reports
Usage tables may need indexes such as:
tenant_id created_at feature model provider user_id
Choose indexes based on actual reporting queries.
Avoid Scanning Millions of Rows
Don't calculate:
Monthly Cost
by scanning every raw usage event on every dashboard load.
Use:
Aggregates Cached Reports Materialized Summaries
where appropriate.
Report Caching
A monthly report can itself be cached:
August Report
and refreshed when new usage arrives or at scheduled intervals.
Real-Time vs Delayed Reports
Real-Time
Useful for:
Current Usage Quota Alerts
Delayed
Useful for:
Profitability Historical Analysis Large Reports
Choose based on business need.
Cost Report Export
Administrators may need:
CSV JSON PDF
exports.
The exported data should respect authorization and data-retention policies.
Cost Report Permissions
Define who can see:
Platform Costs Tenant Costs User Costs Provider Costs
A normal user should not automatically receive global infrastructure information.
Tenant Cost Reports
Tenant administrators can see:
Their AI Usage Their Cost Their Credits Their Features
without seeing other tenants.
User Cost Reports
Users may see:
Their Own Usage Their Credits Their AI Features
depending on product design.
Sensitive Cost Data
Provider rates, margins, and platform-wide costs may be commercially sensitive.
Protect them accordingly.
Cost Report API
A secure endpoint can return:
{ "requests": 5000, "input_tokens": 8000000, "output_tokens": 1500000, "estimated_cost": 4200 }
The exact schema depends on the application.
Cost API Filtering
Allow filters such as:
Date Range Feature Model Provider Tenant User
with server-side permission filtering.
Cost API Pagination
Large usage-event responses should be paginated.
Don't return millions of raw events in one request.
Reconciliation With Provider Billing
At the end of a period:
Internal Usage vs Provider Billing
should be compared where provider reporting supports it.
Reconciliation Differences
Possible causes include:
Missing Events Duplicate Events Incorrect Pricing Provider-Specific Billing Failed Recording
Pricing Changes
If provider pricing changes:
Old Price → New Price
store both versions.
Historical Report Accuracy
A report generated six months later should still accurately reflect the pricing context of old usage.
AI Cost Reports and Credits
Show:
Provider Cost: ₹5,000 Customer Credits: 25,000
rather than presenting them as the same metric.
Credits-to-Cost Analysis
A useful report can calculate:
Provider Cost ÷ Credits Consumed
to evaluate credit economics.
Credit Margin
For example:
Credits Revenue: ₹20,000 Provider Cost: ₹7,000 AI Contribution: ₹13,000
This is an operating metric, not full net profit.
Cost Optimization Recommendations
A dashboard can identify:
High-Cost Feature High-Retry Model Large Prompt Low Cache Hit Rate
and suggest investigation.
Automated Cost Alerts
For example:
Feature: Document AI Budget: ₹20,000 Current: ₹19,200
→
Budget Alert
Cost Forecast Alerts
If projected cost exceeds budget:
Forecast: ₹120,000 Budget: ₹100,000
notify administrators.
AI Cost Report Security
Protect:
Usage Pricing Revenue Margins Tenant Data
with appropriate authorization.
Never Trust Client Filters
Don't allow a frontend request like:
tenant_id=other
to return another tenant's cost report.
Resolve tenant scope server-side.
Audit Report Access
For sensitive SaaS reporting, optionally record:
Who Viewed Report Which Report When
according to the application's governance requirements.
Common AI Cost Reporting Mistakes
Tracking Only Requests
Requests do not reveal actual usage.
Using Current Prices for Historical Data
Past reports become inaccurate.
Mixing Credits With Provider Cost
They represent different accounting layers.
No Feature Attribution
Expensive features remain hidden.
No Retry Tracking
Actual cost is understated.
No Fallback Tracking
Provider costs become incomplete.
No Cache Savings
Optimization opportunities remain invisible.
No Tenant Isolation
Reports can expose another customer's data.
Scanning Raw Events on Every Dashboard Load
Reports become slow at scale.
No Usage Reconciliation
Internal accounting can drift from provider billing.
No Error Cost Tracking
Failed operations may consume resources without appearing in cost analysis.
No Forecasting
Budget overruns can become reactive rather than predictable.
No Audit
Sensitive reports can be accessed without traceability.
AI Cost Reporting Checklist
- [ ] Track request ID - [ ] Track job ID - [ ] Track user - [ ] Track site - [ ] Track tenant - [ ] Track feature - [ ] Track task - [ ] Track model - [ ] Track provider - [ ] Track input usage - [ ] Track output usage - [ ] Track total usage - [ ] Track cached usage - [ ] Track retries - [ ] Track fallbacks - [ ] Track status - [ ] Track estimated cost - [ ] Track actual cost - [ ] Version pricing - [ ] Normalize providers - [ ] Store raw events - [ ] Build daily aggregates - [ ] Build monthly aggregates - [ ] Add indexes - [ ] Add report caching - [ ] Add cost forecasts - [ ] Add budget alerts - [ ] Add anomaly detection - [ ] Add reconciliation - [ ] Add CSV/JSON export - [ ] Add permission controls - [ ] Add tenant isolation - [ ] Add audit logging - [ ] Test duplicate events - [ ] Test retries - [ ] Test fallbacks - [ ] Test pricing changes
Best Practices for Building AI Cost Reports in WordPress
A professional WordPress AI cost-reporting system should:
Track provider usage at the individual operation level whenever possible.
Associate each usage event with the correct logical job, user, site, tenant, task, feature, model, and provider.
Separate provider usage from customer-facing credits and revenue.
Normalize provider-specific usage fields into a common internal data structure.
Maintain a versioned pricing registry so historical reports remain accurate after pricing changes.
Store estimated usage and estimated cost separately from actual provider-reported usage and final cost.
Track retries and fallback-model requests as separate provider operations under the same logical job.
Record failed requests that consumed provider resources.
Track cache hits and estimated cost avoided separately from actual provider consumption.
Break down costs by feature, task, model, provider, plan, tenant, site, user, and date.
Calculate cost per successful task rather than relying only on request counts.
Track both input-driven and output-driven costs to identify expensive prompts and oversized responses.
Track RAG context size, embeddings, document-processing stages, and conversation history where they materially affect cost.
Use raw events for audit/reconciliation and aggregated tables for fast reporting.
Index usage records according to actual reporting queries.
Avoid scanning millions of raw usage rows for every dashboard request.
Cache expensive historical reports when real-time precision is not required.
Provide separate platform, tenant, and user reporting scopes.
Enforce report permissions and tenant isolation server-side.
Never trust client-supplied tenant or user identifiers for report access.
Provide date, feature, model, provider, user, and tenant filters with server-side authorization.
Paginate detailed usage-event exports and reports.
Reconcile internal usage with provider usage or billing reports where available.
Track provider pricing changes with effective dates and versions.
Monitor cost trends and forecast future spending using clearly labeled estimates.
Add budget thresholds and alerts for platform, tenant, and feature spending.
Detect unusual spikes in tokens, requests, retries, or cost.
Protect commercially sensitive provider rates, margins, and platform-wide cost information.
Maintain audit records for important report access and administrative cost changes where appropriate.
Define retention and deletion rules for usage metadata and any associated customer information.
Test duplicate usage events, concurrency, retries, fallbacks, cache savings, failed requests, pricing changes, report authorization, and cross-tenant isolation.
Why choose ThemeKaddora?
ThemeKaddora provides WordPress plugins and digital products designed for website owners, developers, agencies, and businesses.
Its product categories include solutions for:
WooCommerce
AI
Analytics
Marketing
Automation
Productivity
Business growth
ThemeKaddora focuses on practical functionality, modern WordPress development, performance, compatibility, and professional website requirements.
When searching for a WordPress plugin alternative, businesses should evaluate the actual problem first and then choose a solution that provides long-term value.
Conclusion
AI cost reports turn raw AI activity into actionable business information.
A mature architecture is:
AI Request ↓ Provider Usage ↓ Normalization ↓ Pricing ↓ Cost ↓ Aggregation ↓ Reporting ↓ Optimization
The first principle is track at the operation level.
Without detailed events, it becomes difficult to understand exactly where AI resources are being consumed.
The second principle is separate accounting layers.
Provider usage, provider cost, customer credits, and revenue are related but different.
The third principle is preserve historical pricing.
Reports should reflect the pricing context of the original request.
The fourth principle is attribute cost correctly.
Feature, model, provider, tenant, user, and plan breakdowns make optimization possible.
The fifth principle is track failures and retries.
A failed request can still consume provider resources.
The sixth principle is track cache savings.
Avoided provider usage can represent meaningful cost savings.
The seventh principle is aggregate for scale.
Raw usage events provide detail, while daily and monthly aggregates make dashboards fast.
The eighth principle is forecast and alert.
A cost report should help answer not only:
"What did we spend?"
but also:
"Where are we heading?"
The ninth principle is protect report data.
Tenant cost, provider pricing, margins, and user usage may be sensitive.
The tenth principle is use cost data to improve architecture.
Cost reports should reveal opportunities for:
Model Routing Caching Prompt Optimization Context Reduction Batching Retry Optimization Quota Changes Plan Optimization
For ThemeKaddora, a complete AI financial-observability layer can support:
AI Usage Events Provider Cost Tracking Pricing Registry Feature Cost Reports Model Cost Reports Tenant Cost Reports User Cost Reports AI Credit Analytics Cache Savings Retry Costs Fallback Costs RAG Costs Embedding Costs Budget Alerts Forecasting Anomaly Detection Provider Reconciliation Plan Profitability
The most important principle is:
Build AI cost reporting as an auditable data pipeline that records authoritative usage, applies versioned pricing, separates customer credits from provider expenses, and provides tenant-safe analytics for optimization and financial planning.
A professional WordPress AI cost-reporting system should be:
Accurate
→ Provider-Aware
→ Historically Correct
→ Tenant-Safe
→ Feature-Aware
→ Cost-Aware
→ Auditable
→ Forecastable
→ Scalable
→ Actionable
When these principles are applied, WordPress AI plugins and SaaS products can move beyond simply knowing that AI was used and instead understand exactly where AI money is being spent, why costs are changing, which customers and features are driving usage, and which engineering changes can improve the economics of the platform.
Frequently Asked Questions
What is an AI cost report?
An AI cost report shows AI usage, provider consumption, estimated or actual cost, customer credits, and cost breakdowns by dimensions such as tenant, user, feature, model, provider, and date.
Why track AI costs in WordPress?
AI costs can grow quickly with usage. Cost reports help identify expensive features, control budgets, improve model selection, and design profitable SaaS plans.
Are AI provider costs the same as customer charges?
No. Provider costs represent infrastructure expense, while customer credits, subscriptions, and overage charges represent your product's commercial model.
What usage data should I track?
Track input usage, output usage, total usage, model, provider, feature, task, job, user, tenant, status, timestamp, retries, and fallbacks where relevant.
Why should I store job IDs?
A job ID links multiple provider attempts, retries, fallbacks, usage events, and results to one logical operation.
Why should I track request IDs?
Provider request IDs can help with troubleshooting, provider support, and usage reconciliation when available.
What is a pricing registry?
A pricing registry stores model/provider pricing with versions and effective dates so cost calculations remain historically accurate.
Why should pricing be versioned?
Provider prices can change. Historical usage should remain associated with the pricing context that applied when the request occurred.
Should I track estimated cost?
Yes. Estimated cost can support quota checks, budget reservations, warnings, and batch planning.
Should I track actual cost?
Yes. Actual provider-reported usage should be used for final reconciliation whenever reliable provider data is available.
Why choose Themekaddora?
Themekaddora provides lightweight, responsive, SEO-friendly WordPress themes with fast performance, WooCommerce compatibility, flexible customization, accessibility-conscious design, modern templates, regular updates, and professional support—providing a strong foundation for businesses building digital products and product-focused websites.
Comments (0)