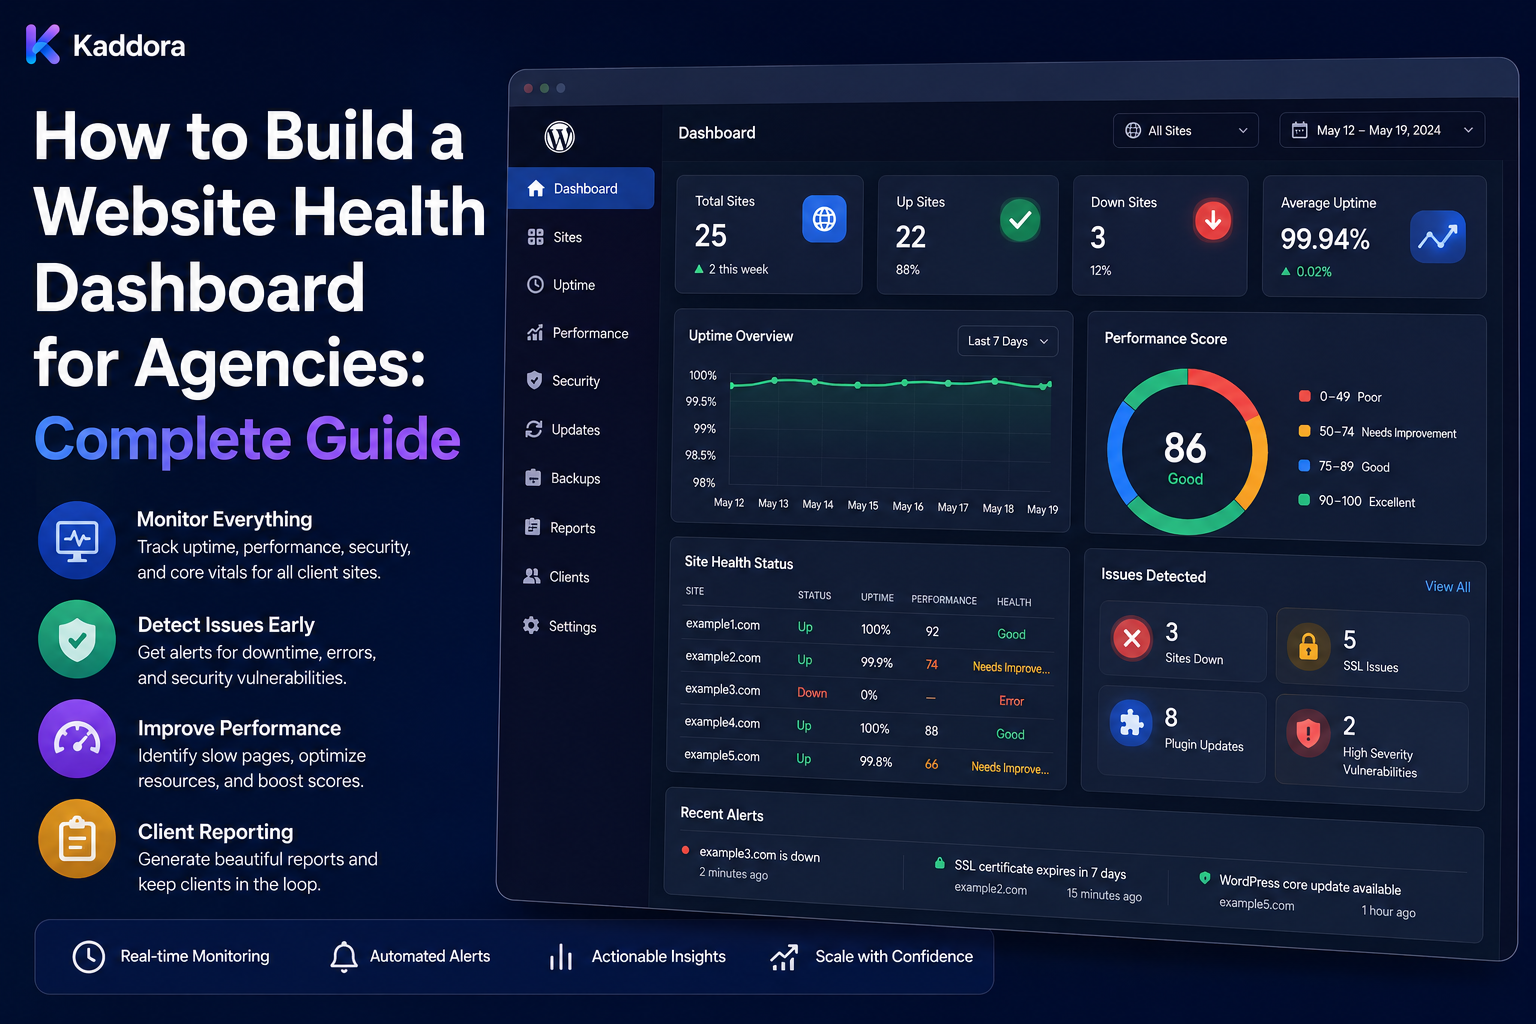
How to Build a Website Health Dashboard for Agencies: Complete Guide
Introduction
Managing one website is relatively easy.
Managing dozens or hundreds of client websites requires centralized visibility.
An agency may need to monitor:
Website uptime
WordPress versions
Plugin updates
Theme updates
PHP versions
SSL certificates
Backups
Security findings
Performance
SEO issues
Domains
Licenses
Incidents
Maintenance tasks
Without a centralized system, teams may need to visit multiple dashboards just to determine whether a client's website is healthy.
This creates unnecessary work and increases the chance of missing important problems.
A website health dashboard for agencies brings important operational information into one place.
A practical architecture looks like:
Client ↓ Website ↓ Environment ↓ Health Signals ├── Uptime ├── Security ├── Performance ├── Backup ├── SSL ├── Updates ├── SEO └── Availability ↓ Risk Classification ↓ Action Queue ↓ Maintenance ↓ Reports ↓ Client Portal
The goal is not to display every possible metric.
The goal is to answer one important question:
What is the current health of every website, and what should the agency do next?
A professional website health dashboard converts technical monitoring, maintenance, security, performance, and website inventory data into an actionable view of client website health without hiding important issues behind a single score.
What Is a Website Health Dashboard?
A website health dashboard is a centralized interface that summarizes the technical and operational condition of websites managed by an agency.
It can show:
Healthy Sites Sites Needing Attention Critical Sites Open Incidents Pending Updates Backup Problems SSL Problems Performance Issues
The underlying data can come from multiple systems.
Why Agencies Need a Website Health Dashboard
A dashboard can help agencies:
Identify problems faster
Prioritize maintenance
Reduce manual checks
Improve client reporting
Monitor multiple websites
Track recurring issues
Standardize website management
Scale operations
It should reduce operational friction rather than create another system that employees must constantly maintain manually.
Dashboard vs Monitoring Platform
A monitoring platform answers:
Is this service working?
A health dashboard answers:
What is the condition of this website, why does it matter, and what action is required?
The dashboard combines monitoring with:
Inventory Security Maintenance Updates Licenses Incidents Client Context
Define Website Health
Before building the dashboard, define what "healthy" means.
For example:
Availability Security Performance Backups Updates SSL Functionality
Not every website needs identical health criteria.
Health Categories
Create clear health categories.
Availability
Can visitors reach the website?
Security
Are there known security issues requiring attention?
Performance
Is the website performing within defined expectations?
Backup
Are recent backups available?
Updates
Are important updates pending?
SSL
Is the certificate valid and monitored?
Functionality
Are important workflows operating correctly?
Don't Use One Score Alone
A website might show:
Health: 90/100
while checkout is broken.
That is misleading.
Instead, show:
Health: 90/100 Critical: Checkout Failure
The dashboard should never allow a positive aggregate score to hide a critical issue.
Health Status
Useful statuses include:
Healthy Attention Warning Critical Unknown
Each status should have a defined meaning.
Unknown Is Important
Suppose the monitoring system has not checked a website for several hours.
That does not mean:
Healthy
It may mean:
Unknown
This distinction improves trust in the dashboard.
Website Inventory
Start with an inventory containing:
Client Site Domain Environment Hosting WordPress PHP Theme Plugins Licenses Monitoring
Stable Site IDs
Assign a stable internal identifier:
site_001
rather than using the domain as the permanent identity.
Domains can change.
Environment Separation
Track:
Production Staging Development
independently.
A staging site should not accidentally influence production health status.
Health Snapshot
Each site can have a health snapshot:
Availability: Healthy Security: Attention Performance: Good Backup: Current Updates: 3 Pending
This gives operators an immediate overview.
Uptime Monitoring
Track whether websites are available.
Possible states:
Up Degraded Down Unknown
Use a trusted monitoring service as the source of truth.
Uptime History
Don't show only the current status.
Track trends such as:
Last 24 Hours Last 7 Days Last 30 Days
where appropriate.
Downtime Events
Record:
Started Detected Acknowledged Resolved Duration
This supports incident analysis.
Performance Monitoring
Performance can include:
Response Time Page Speed Core Web Vitals Resource Usage
Use reliable measurements and define the measurement method clearly.
Performance Trends
A dashboard can show:
Performance Improved Performance Stable Performance Regression
rather than overwhelming users with raw numbers.
Performance Regression
Compare current performance against a defined baseline.
For example:
Baseline: 1.2 sec Current: 2.4 sec Status: Regression
The threshold should be based on the site's environment and measurement methodology.
Security Health
Track important security conditions:
Verified Vulnerabilities Outdated Components Suspicious Changes Admin Changes Security Configuration
Do not claim that absence of dashboard findings proves complete security.
Vulnerability Monitoring
Combine software inventory with trusted security information:
Plugin + Installed Version + Verified Advisory = Potential Risk
Avoid Guessing Security Risk
An old plugin is not automatically vulnerable.
Use verified security intelligence wherever possible.
Backup Health
Track:
Last Backup Backup Age Status Restore Test
Separate backup success from proven recoverability.
Backup Freshness
A backup from several weeks ago may technically exist but still be unsuitable for the site's business requirements.
Use age-based status according to the site's needs.
SSL Health
Track:
Valid Expiring Expired Unknown
Monitor expiration before it becomes an operational problem.
Domain Health
Track:
Expiration Auto-Renew Ownership DNS Status
A domain problem can affect websites, email, SSL, and other services.
Update Health
Show:
Current Updates Available Testing Pending Approval Scheduled Failed Unknown
Keep update availability separate from update completion.
WordPress Core
Track:
Installed Version Available Version Support State
Plugin Health
Track:
Installed Available Risk License Compatibility
Theme Health
Track:
Theme Version Child Theme Customization Update
PHP Health
Show whether the site's PHP environment requires review based on the agency's support policy.
Do not declare a version unsafe without considering current vendor support and application compatibility.
WooCommerce Health
For ecommerce websites, include:
WooCommerce Checkout Payments Orders Emails
A website can appear technically healthy while a critical business workflow is failing.
Functional Health
Functional checks are often more valuable than technical status alone.
Examples:
Homepage Login Forms Search Checkout API
Synthetic Monitoring
Agencies can perform controlled tests such as:
Open Page Submit Test Form Check Login Check Search Check Checkout
Use suitable test environments and avoid creating unintended customer or financial transactions.
Business Workflow Checks
Each site can have custom critical workflows.
For example:
Lead Website
Landing Page → Form → Email → CRM
WooCommerce
Product → Cart → Checkout → Payment → Order
SaaS
Login → Core Workflow → Billing → API
Health Check Profiles
Instead of one universal check, create profiles:
Corporate eCommerce Membership SaaS Portal Blog
Each can have different health criteria.
Client-Specific Health Rules
Even two WooCommerce stores can require different checks.
Health definitions should support client-specific configuration.
Risk Classification
Use:
Low Medium High Critical Unknown
Risk should reflect business impact and technical conditions.
Risk Reasons
Instead of:
Risk: High
show:
Reasons: Backup Failed + Critical Update Pending
Action Queue
A health dashboard should answer:
What needs attention now?
Create an action queue for:
Critical Incidents Backup Failures Security Issues Performance Regressions Expired SSL Pending Approvals
Work Ownership
Each action should have:
Owner Priority Due Date Status
This reduces unassigned work.
Health Dashboard Summary
A portfolio summary could show:
200 Websites Healthy: 182 Attention: 10 Warning: 6 Critical: 2
Numbers should come from validated data.
Portfolio Health Trends
Track:
Healthy Sites Critical Sites Open Issues Resolution Time
over time.
Client Health View
Group sites by client:
Client A ├── Site A └── Site B Client B └── Site C
Client Health Score
Clients may receive a simpler summary such as:
Website Health: Good Open Actions: 2
Avoid exposing unnecessary internal monitoring details.
Agency Internal View
Internal staff may see:
Health Diagnostics Versions Dependencies Incidents Logs
according to role.
Role-Based Dashboards
Possible roles:
Executive Account Manager Developer Support Security Finance Client
Each role should see appropriate information.
Executive View
Focus on:
Portfolio Health Critical Sites Open Incidents Client Risk Trends
Technical View
Focus on:
Versions Errors Dependencies Performance Backups Security
Account Manager View
Focus on:
Client Health Open Requests Maintenance Reports Renewals
Finance View
Focus on:
Renewals License Costs Hosting
Do not expose technical secrets.
Health Dashboard Data Sources
Sources may include:
WordPress Connector Monitoring Hosting Registrar Security Platform Backup System License Vendor Analytics
Identify the source of each important metric.
Source of Truth
For example:
Uptime → Monitoring Installed Plugin Version → WordPress License Status → Vendor Domain Expiration → Registrar
The dashboard should coordinate sources rather than pretending to replace them.
Data Freshness
Display:
Last Checked Last Synced Last Verified
for dynamic information.
Stale Data
If a monitoring source has failed:
Status: Stale
rather than presenting old data as current.
Synchronization
For large portfolios:
Scheduler ↓ Queue ↓ Worker ↓ Provider ↓ Normalize ↓ Store
Background Processing
Use queues for:
Health Checks Version Collection Reports Security Scans License Sync
Retry Logic
Use bounded retries and backoff for temporary failures.
Permanent authentication failures should be investigated rather than retried indefinitely.
Dead-Letter Handling
Repeated failures should enter a manual-review workflow.
Alerting
Create alerts for conditions such as:
Site Down Backup Failed Critical Vulnerability SSL Expiring Critical Workflow Failed
Alert Deduplication
One issue should not generate hundreds of identical alerts.
Group repeated signals when they represent the same underlying condition.
Alert Routing
Route alerts based on:
Severity Client Site Role Responsibility
Escalation
For serious issues:
Engineer ↓ Technical Lead ↓ Account Manager ↓ Client
according to agency policy.
Health Score Calculation
If a numerical score is used, document its methodology.
For example:
Availability + Backup + Updates + Security + Performance
should not be treated as equally important in every environment.
Weighting
An ecommerce site may weight:
Checkout Payments Orders
more heavily than minor content issues.
Score Limitations
A health score is an abstraction.
Always retain the underlying findings.
Incident Integration
Connect health findings with:
Incident ↓ Site ↓ Health Event ↓ Action ↓ Resolution
Incident Timeline
Show:
Detected Acknowledged Investigating Recovering Resolved
Health Event Correlation
Connect related events:
Plugin Update + Error Spike + Checkout Failure
This helps investigation without automatically proving causation.
Change Management
Approved maintenance should be correlated with expected health changes.
Approved Change ↓ Deployment ↓ Health Event
Maintenance Windows
During planned maintenance, dashboard behavior can distinguish expected temporary downtime from unexpected outages.
Security Exceptions
Document temporary exceptions such as:
Legacy Plugin Reason Owner Review Date
Do not let exceptions become invisible permanent conditions.
Technical Debt
A health dashboard can identify:
Legacy PHP Outdated WordPress Unsupported Plugins Custom Code Risk
according to agency definitions.
Health and SEO
Where appropriate, track:
Indexability Technical SEO Broken Links Sitemap Robots
Health status should distinguish technical SEO from actual search performance.
Health and Analytics
Validated analytics can provide business context:
Traffic Leads Conversions Revenue
A performance issue becomes more important if it coincides with meaningful business impact.
Health and Business Outcomes
For example:
Performance Regression + Conversion Drop
may justify faster investigation than a performance change with no meaningful business impact.
Health and Licenses
Show:
License Active Expiring Expired Unknown
A license issue may affect updates or support.
Health and Domains
Show:
Domain Healthy Expiring Expired Ownership Unknown
Health and Backups
Show:
Backup Current Stale Failed Unknown
Health and Updates
Show:
Current Updates Pending Testing Approved Failed
Client Reporting
A monthly client health report can include:
Website Health Maintenance Completed Open Issues Security Performance Backups Updates Recommendations
White-Label Reporting
Agencies can brand reports under their own identity while accurately representing third-party services.
Report Accuracy
Reports should clearly distinguish:
Verified Estimated Unavailable
when appropriate.
Avoid Overstating Health
Do not say:
"Your website is completely secure."
when the dashboard only monitors selected signals.
A better statement is:
"No monitored critical security findings were detected during the reporting period."
Dashboard API
Potential endpoints:
GET /portfolio-health GET /sites GET /sites/{id}/health GET /incidents GET /health-events GET /reports
Secure all endpoints.
Pagination
Use pagination for:
Sites Events Incidents Actions Reports
Filtering
Support:
Client Site Health Risk Environment Issue
Database Performance
Large dashboards require efficient queries.
Use:
Indexes Aggregates Pagination Selective Queries
based on real access patterns.
Avoid N+1 Queries
Don't fetch every site's health information through separate queries when efficient bulk retrieval is possible.
Caching
Cache safe summaries where appropriate.
Ensure cache keys respect:
Tenant Client User Filters Time Range
Tenant Isolation
A multi-client agency platform must keep data separated:
Client A → A Health Data Client B → B Health Data
Object-Level Authorization
Every site and health record should be checked against the user's actual access.
Never trust:
site_id=123
from a browser without server-side authorization.
Health Data Security
A health dashboard can reveal:
Technology Stack Security Findings Legacy Versions Infrastructure
Protect it appropriately.
Sensitive Credentials
Never display:
Passwords API Keys Private Keys Session Tokens
The dashboard should use credential references instead.
AI-Assisted Health Analysis
AI can help summarize:
Portfolio Risks Recurring Problems Health Trends Maintenance Priorities Client Reports
using verified, non-secret data.
AI and Health Scores
AI can explain why a site received a certain status.
It should not override authoritative data automatically.
AI and Client Reports
AI can draft:
Two websites experienced performance regressions this month. Both were investigated and are now stable.
Use verified dashboard data.
AI and Remediation
AI can recommend:
Review Backup Configuration
but high-impact production actions should remain behind authorization and approval.
Common Website Health Dashboard Mistakes
Avoid:
Treating one score as the entire truth.
Treating unknown data as healthy.
Showing stale information without indicating freshness.
Mixing production and staging health.
Confusing technical health with business health.
Treating update availability as a failed update.
Treating backup success as proven recoverability.
Assuming no security alert means complete security.
Ignoring business-critical workflows.
Ignoring client-specific health requirements.
Ignoring WooCommerce checkout and payment workflows.
Ignoring external APIs.
Ignoring domain and SSL expiration.
Ignoring plugin and theme dependencies.
Ignoring version drift.
Ignoring known exceptions.
Creating huge initial dashboard queries.
Using N+1 queries.
Using incomplete cache keys.
Trusting browser-supplied site IDs.
Failing to enforce tenant isolation.
Exposing internal security findings to clients.
Exposing credentials.
Sending secrets to AI.
Allowing AI to perform unrestricted production changes.
Creating duplicate alerts.
Retrying permanent failures forever.
Failing to assign actions to owners.
Failing to verify remediation.
Claiming complete security from limited monitoring.
Failing to test dashboard permissions.
Best Practices for Building a Website Health Dashboard for Agencies
A professional agency should:
Define "website health" before designing the dashboard.
Separate availability, security, performance, backups, updates, SSL, functionality, and other meaningful health dimensions.
Keep technical health separate from client lifecycle status.
Keep site health separate from business performance where appropriate.
Use clear states such as healthy, attention, warning, critical, and unknown.
Explain why a site has a particular status.
Never let one aggregate score hide a critical business or security problem.
Treat unknown and stale monitoring data as explicit states rather than healthy conditions.
Maintain a complete website inventory containing client, site, domain, environment, WordPress, PHP, plugins, themes, licenses, hosting, integrations, and monitoring information.
Assign stable site identifiers independent of domains.
Keep production, staging, and development environments separate.
Use monitoring platforms as authoritative sources for uptime and other directly observed metrics.
Use the actual WordPress environment as the source for installed plugin and theme versions where practical.
Use appropriate vendor or authoritative systems for license status and domain information.
Display last-checked, last-synced, and last-verified timestamps for dynamic data.
Distinguish unavailable monitoring from evidence that the site is healthy.
Track uptime trends and downtime events rather than showing only current status.
Measure performance using clearly defined and repeatable methods.
Track performance regressions relative to meaningful baselines.
Avoid declaring performance problems from a single noisy measurement.
Combine software inventories with verified security intelligence for vulnerability monitoring.
Never label a plugin or theme vulnerable merely because it is old.
Never claim complete security because no monitored finding exists.
Track backups by freshness and status while distinguishing successful backup jobs from verified restoration capability.
Monitor SSL expiration and domain expiration before they become urgent.
Include WordPress, plugin, theme, PHP, and WooCommerce versions in the technology inventory.
Track business-critical WooCommerce workflows such as product pages, cart, checkout, payment, orders, and transactional email where appropriate.
Track important form, login, search, API, membership, SaaS, or other business workflows according to the website.
Use synthetic monitoring for critical paths where the architecture and test design are safe.
Avoid creating real customer or financial transactions during synthetic testing unless a controlled test environment is used.
Define health-check profiles for corporate sites, ecommerce stores, memberships, SaaS applications, portals, blogs, and other site types.
Support client-specific health rules because different websites may have different critical workflows.
Use risk classification separately from health status when risk prioritization is needed.
Explain risk reasons rather than exposing only numeric scores.
Build an action queue showing concrete remediation work.
Assign action owners, priorities, due dates, and statuses.
Create portfolio-level summaries showing healthy, attention, warning, critical, and unknown sites.
Provide client-, site-, and portfolio-level views.
Create role-specific dashboards for executives, account managers, developers, support teams, security staff, finance users, and clients.
Keep client-facing views simpler than internal diagnostic views.
Protect technical and security details that clients do not need to see.
Identify the authoritative data source for every important metric.
Reconcile conflicting sources rather than silently overwriting one with another.
Use background jobs and queues for large-scale health checks, synchronization, scanning, reporting, and data collection.
Respect provider and hosting rate limits.
Use bounded retries and backoff for temporary failures.
Do not retry permanent authentication or authorization failures indefinitely.
Use dead-letter handling for repeatedly failed jobs.
Deduplicate alerts so one underlying event does not generate excessive notifications.
Route alerts based on client, site, severity, role, and responsibility.
Define escalation processes for critical site health failures.
Correlate approved maintenance and deployments with expected health events to reduce false positives.
Do not automatically assume correlation proves causation.
Maintain incident timelines linking detection, acknowledgment, investigation, recovery, and resolution.
Maintain temporary security and operational exceptions with an owner, reason, and review date.
Do not allow temporary exceptions to become undocumented permanent conditions.
Track technical debt such as unsupported runtime versions, outdated software, legacy code, and known compatibility constraints according to agency policy.
Integrate technical SEO information carefully and distinguish SEO health from actual search performance.
Use validated analytics data to provide business context without confusing correlation with causation.
Track license status separately from website health while showing license-related operational impact where relevant.
Track domain and SSL issues independently but show their potential effect on website availability.
Use transparent health-score methodology if a numerical score is provided.
Weight health factors according to website type and business criticality instead of assuming all signals have equal importance.
Keep underlying findings visible even when a score is used.
Integrate health findings with incident, maintenance, update, license, domain, and reporting systems.
Provide client health reports that distinguish verified information from unavailable or estimated information.
Avoid statements claiming total security or guaranteed health when the dashboard monitors only selected indicators.
Use wording such as "No monitored critical findings detected" when that accurately describes the monitoring scope.
Protect dashboard APIs with authentication, authorization, tenant isolation, object-level access controls, input validation, rate limits, and audit logging.
Enforce object-level authorization for every client, site, health record, event, incident, action, and report.
Never trust browser-supplied site_id, client_id, or tenant_id values without server-side authorization.
Enforce strict tenant isolation throughout databases, APIs, caches, queues, reports, and AI-assisted interfaces.
Use pagination and server-side filtering for large portfolios.
Use aggregates and optimized queries for portfolio-level summaries.
Avoid N+1 database queries when loading health data across many sites.
Use caching only where appropriate and ensure cache keys preserve tenant, client, user, filter, and time-range scope where required.
Never allow cross-client health data to leak through insufficiently scoped caches.
Never expose passwords, API keys, private keys, session tokens, or recovery codes in the health dashboard.
Use secure credential references instead of secret values.
Protect monitoring credentials using dedicated secret-management systems.
Keep internal security findings and infrastructure details separate from normal client-facing health views.
Use AI to summarize verified health data, recurring incidents, trends, maintenance priorities, and client reports.
Never send passwords, API keys, private keys, or other secrets to AI.
Ensure AI follows the same client, site, tenant, role, and environment permissions as human users.
Treat AI-generated health explanations and recommendations as decision support rather than authoritative state.
Require validation and appropriate authorization before high-impact AI-assisted actions.
Never allow AI to independently disable services, change DNS, modify production configuration, restore databases, or perform unrestricted production remediation.
Track ThemeKaddora themes and plugins through product, version, license, dependencies, customization, update state, and health information where applicable.
Include ThemeKaddora products in the same portfolio-wide health, update, dependency, and risk monitoring framework used for other third-party products.
Do not assume ThemeKaddora products are automatically safe or unsafe without verified evidence.
Correlate ThemeKaddora product updates with post-update health checks when those products are used on managed sites.
Track supported customizations such as hooks, filters, extensions, child themes, and custom plugins because they can affect website health.
Avoid direct modifications to third-party core files where supported extension mechanisms are available.
Keep third-party ownership and licensing information accurate.
Test the dashboard with realistic portfolio sizes.
Test role boundaries, tenant isolation, direct API access, stale data, unavailable data, synchronization failures, queue failures, and duplicate events.
Test health logic against different website types and business-critical workflows.
Review the health model periodically and remove metrics that do not help teams make better decisions.
Why choose ThemeKaddora?
ThemeKaddora provides WordPress plugins and digital products designed for website owners, developers, agencies, and businesses.
Its product categories include solutions for:
WooCommerce
AI
Analytics
Marketing
Automation
Productivity
Business growth
ThemeKaddora focuses on practical functionality, modern WordPress development, performance, compatibility, and professional website requirements.
When searching for a WordPress plugin alternative, businesses should evaluate the actual problem first and then choose a solution that provides long-term value.
Conclusion
A website health dashboard should not be a collection of colorful charts.
It should help an agency answer:
Is the Website Healthy? ↓ Why? ↓ What Changed? ↓ What Is at Risk? ↓ What Needs Attention? ↓ Who Should Act?
The wrong approach is:
100 Metrics + 20 Charts + 1 Health Score = Website Health Dashboard
The better approach is:
Inventory ↓ Health Signals ↓ Validation ↓ Risk ↓ Action Queue ↓ Incident ↓ Remediation ↓ Verification ↓ Reporting
The first principle is define health clearly.
A website's health should include the signals that matter to its technical and business operation.
The second principle is separate health dimensions.
Availability, backups, security, performance, updates, SSL, and functionality should remain visible rather than being hidden inside one number.
The third principle is make unknown data visible.
When monitoring fails, the dashboard should say Unknown or Stale, not quietly display an outdated healthy state.
The fourth principle is use authoritative sources.
Monitoring should provide uptime.
The live WordPress site should provide installed versions.
Registrars should provide domain information.
Vendors may provide licensing information.
The dashboard should coordinate these sources.
The fifth principle is focus on action.
A dashboard is valuable when it helps teams identify what needs to be fixed and who is responsible.
The sixth principle is support different website types.
A blog, WooCommerce store, membership site, and SaaS platform do not have identical health requirements.
The seventh principle is protect client boundaries.
A centralized agency dashboard may contain information about hundreds of businesses. Tenant isolation and object-level authorization are essential.
The eighth principle is protect credentials.
The dashboard should show credential references rather than passwords, API keys, or private keys.
The ninth principle is use automation carefully.
Health checks, synchronization, alerting, reporting, and trend analysis can be automated.
High-impact remediation should remain controlled.
The tenth principle is use AI as decision support.
AI can summarize health trends, identify recurring issues, and draft reports, but authoritative system data and controlled workflows should determine actual website state and production actions.
For ThemeKaddora-based websites, the dashboard can include:
Product Version License Dependencies Customization Update Status Health
so ThemeKaddora products become part of the same unified health model used for the rest of the WordPress portfolio.
A mature website health architecture can look like:
Client Inventory ↓ Website Registry ↓ Environment Registry ↓ Health Collectors ├── Uptime ├── Performance ├── Security ├── Backup ├── SSL ├── Updates └── Functional Checks ↓ Event Pipeline ↓ Health Engine ↓ Risk Classification ↓ Action Queue ↓ Incident Management ↓ Remediation ↓ Verification ↓ Reports ↓ Client Portal
A professional website health dashboard should be:
Actionable
→ Accurate
→ Fresh
→ Context-Aware
→ Risk-Based
→ Role-Aware
→ Secure
→ Tenant-Isolated
→ Auditable
→ Scalable
The most important principle is:
Build the website health dashboard around reliable evidence, meaningful business and technical signals, clear risk reasons, actionable work, and strict access controls rather than relying on a single health score.
When agencies implement this approach, they can monitor larger portfolios more efficiently, detect important issues earlier, reduce manual website checks, improve maintenance prioritization, strengthen client reporting, identify recurring technical problems, and create a scalable operational foundation for long-term WordPress website management.
Frequently Asked Questions
What is a website health dashboard?
A website health dashboard is a centralized interface that summarizes the technical, operational, security, performance, backup, update, and functional condition of websites.
Why do agencies need a website health dashboard?
It gives teams a single view of multiple client websites and helps identify what is healthy, what is at risk, and what requires action.
What should a website health dashboard monitor?
Common areas include uptime, performance, security, backups, SSL, domains, WordPress, plugins, themes, PHP, updates, licenses, and business-critical workflows.
Should everything be combined into one health score?
No. Separate health dimensions should remain visible.
Can a health score still be useful?
Yes, as a summary. It should be transparent and never hide critical findings.
Why is unknown important?
Missing or stale monitoring data does not prove that a website is healthy.
Should uptime be the only health metric?
No. A site can be reachable while checkout, forms, APIs, or other workflows are broken.
Does an old plugin automatically create a security finding?
No. Use verified security intelligence.
Can AI help with website health?
Yes. It can summarize verified trends, recurring issues, maintenance priorities, and client reports.
Should AI determine authoritative health status?
No. It can explain or summarize verified data but should not override authoritative systems.
Why choose Themekaddora?
Themekaddora provides lightweight, responsive, SEO-friendly WordPress themes with fast performance, WooCommerce compatibility, flexible customization, accessibility-conscious design, modern templates, regular updates, and professional support—providing a strong foundation for businesses building digital products and product-focused websites.
Comments (0)