
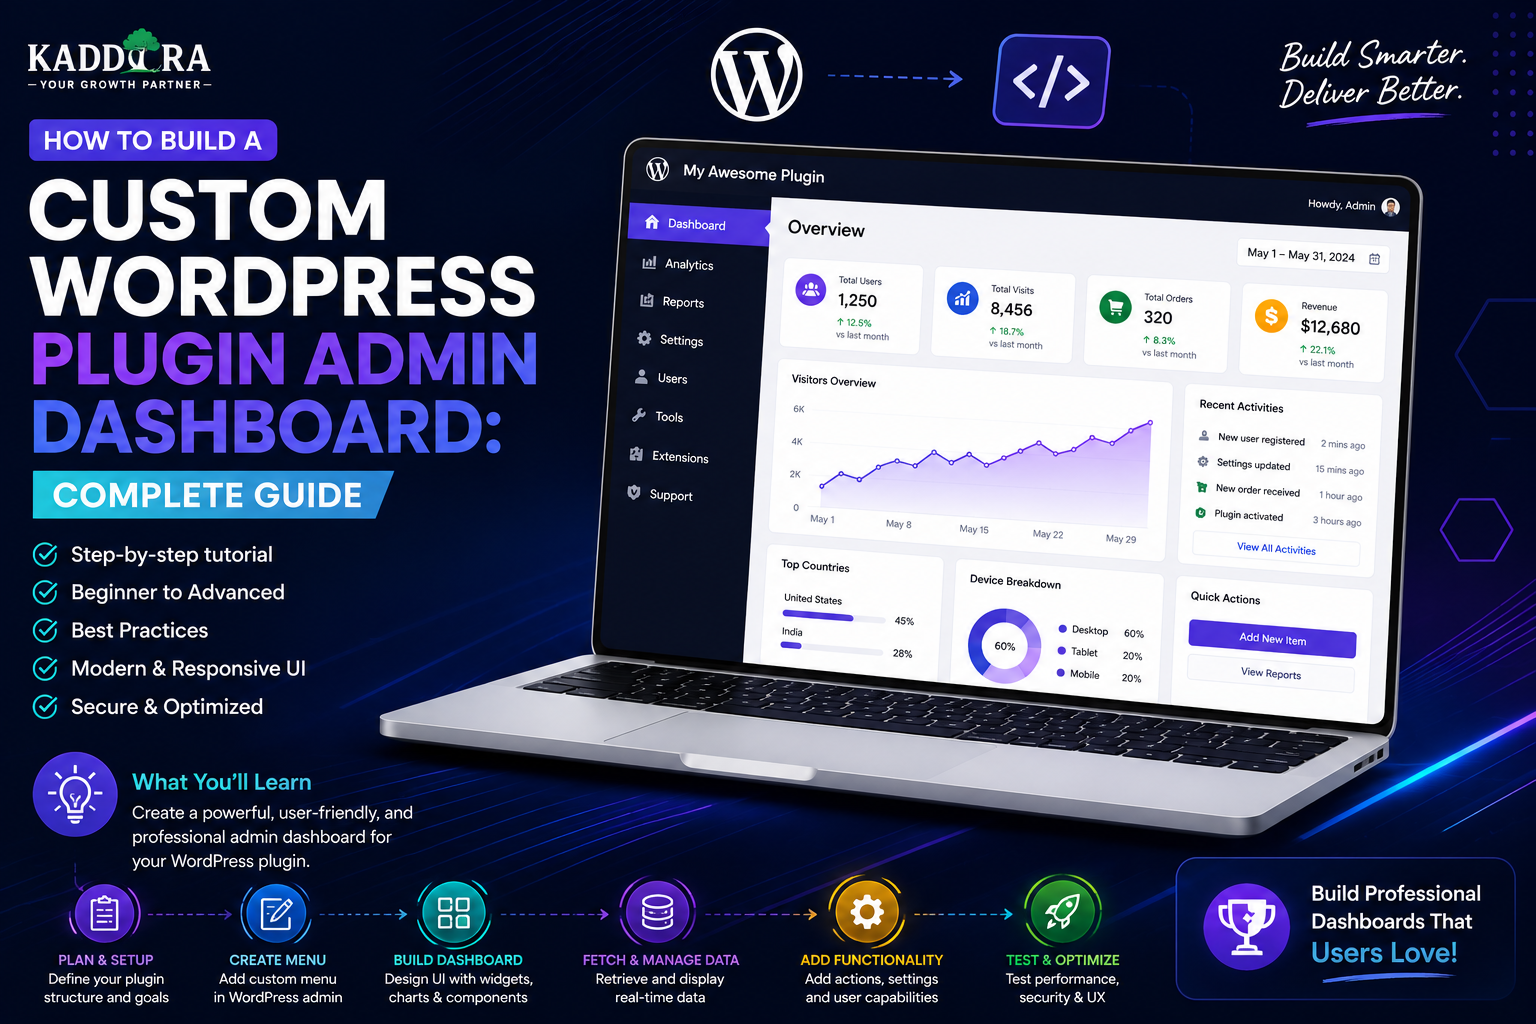
How to Build a Custom WordPress Plugin Admin Dashboard: Complete Guide
Introduction
A professional WordPress plugin is more than a collection of PHP functions.
As a plugin becomes more powerful, administrators need a clear interface for managing:
Settings
Features
Reports
Users
Logs
Analytics
Automation
Licenses
API connections
This is where a custom WordPress plugin admin dashboard becomes important.
Instead of forcing users to navigate through dozens of unrelated WordPress settings pages, a plugin can provide its own centralized dashboard.
A typical plugin dashboard may look like:
Plugin Dashboard │ ├── Overview ├── Settings ├── Analytics ├── Integrations ├── Tools ├── Logs └── Help
A well-designed dashboard helps users understand the plugin quickly and reduces unnecessary configuration complexity.
However, building a professional WordPress admin dashboard requires more than creating an admin menu.
A production-ready dashboard should consider:
WordPress menu APIs
Capabilities
Nonces
Settings management
AJAX or REST APIs
Data validation
Escaping
Admin asset loading
Tables
Charts
Responsive layouts
Accessibility
Performance
Internationalization
Security
In this guide, you'll learn how to build a custom WordPress plugin admin dashboard, structure the interface, create admin menus, add settings, build widgets, load CSS and JavaScript correctly, connect APIs, display analytics, implement secure actions, add charts and tables, and create a scalable admin experience.
What Is a WordPress Plugin Admin Dashboard?
A plugin admin dashboard is a dedicated administration interface where WordPress users can manage a plugin's functionality.
Instead of placing every option under:
Settings
the plugin can create:
My Plugin ├── Dashboard ├── Settings ├── Reports └── Tools
The dashboard becomes the operational center of the plugin.
Why Create a Custom Plugin Dashboard?
A centralized dashboard can help users:
Understand plugin status
Find important settings
View key metrics
Configure integrations
Access tools
Diagnose problems
Discover features
Monitor performance
For complex plugins, this can dramatically improve usability.
Simple Plugin vs Advanced Plugin Dashboard
A small plugin may only need:
Settings
A larger plugin may need:
Overview Analytics Settings Integrations Automation Logs Tools Support
The dashboard should match the plugin's actual complexity.
Don't build unnecessary navigation simply to make the plugin appear larger.
Plan the Dashboard Before Coding
Define the major areas first.
For example:
Dashboard │ ├── Overview ├── Configuration ├── Analytics ├── Integrations ├── Tools └── Support
Then determine:
Which screens are required?
Who can access them?
Which settings belong together?
Which actions are dangerous?
Which data is real-time?
Which data can be cached?
Use the WordPress Admin Menu System
A plugin can register an admin menu and submenu pages.
Conceptually:
add_menu_page( 'Plugin Dashboard', 'My Plugin', 'manage_options', 'my-plugin', 'render_dashboard' );
The exact implementation should follow the plugin's naming, capabilities, and WordPress compatibility requirements.
Choose the Correct Capability
Never assume every administrator page should use:
manage_options
The appropriate capability depends on what the page does.
For example:
View Reports → Custom Capability Change Global Settings → manage_options Manage Plugin Data → Specific Capability
Use the least privilege required.
Create Custom Capabilities
A complex plugin can define capabilities such as:
my_plugin_view_reports my_plugin_manage_settings my_plugin_manage_integrations my_plugin_manage_data
This makes access control more precise.
Do Not Give Plugin Managers Full Administrator Access
A user who needs to manage plugin analytics should not automatically receive access to:
User management
Site settings
Themes
Other plugins
Granular capabilities make enterprise and team environments safer.
Dashboard Layout
A useful dashboard may contain:
Header ↓ Status ↓ Key Metrics ↓ Quick Actions ↓ Recent Activity ↓ System Information
The most important information should appear first.
Dashboard Header
A header can show:
Plugin Name Version 2.4.0 [Settings] [Documentation]
Avoid filling the header with unnecessary promotional elements.
Status Widget
A status card can display:
System Status API: Connected Database: Healthy License: Active Cron: Running
Only show information that helps users understand actual plugin health.
KPI Widgets
For analytics-oriented plugins, display:
Orders Revenue Users Conversions AI Usage
The metrics should be clearly defined.
Quick Actions
Useful dashboard actions include:
Add Product Run Sync Generate Report Configure API View Logs
These actions should lead directly to meaningful workflows.
Recent Activity
An activity widget might display:
Recent Activity 10:32 AM Analytics Sync Completed 10:15 AM New Integration Connected 09:54 AM Report Generated
Avoid exposing sensitive information unnecessarily.
System Notices
Plugins may need to show:
Configuration warnings
Integration failures
Required updates
Missing settings
License status
Compatibility issues
Use notices carefully.
Too many notices make the dashboard difficult to use.
WordPress Admin Notices
A plugin can use WordPress admin notices for important messages.
For example:
Success: Settings saved successfully. Warning: API credentials are missing. Error: Unable to connect to the external service.
Messages should be specific and actionable.
Avoid Permanent Promotional Notices
A plugin dashboard should not become an advertising page.
Users need help managing the plugin.
Important settings and useful diagnostics should take priority over promotional banners.
Settings Screen Design
Group related settings logically.
For example:
General API Notifications Security Advanced
Avoid placing 40 unrelated fields on one page.
Use the WordPress Settings API
For standard configuration, the Settings API provides a structured way to:
Register settings
Register sections
Register fields
Validate values
This keeps configuration consistent with WordPress administration.
Sanitize Settings
Every setting should be validated according to its type.
For example:
Email → Email Validation URL → URL Validation Integer → Integer Validation Boolean → Boolean Handling
Never assume admin input is safe simply because it comes from a logged-in user.
Escape Output
When displaying stored values, escape them appropriately.
For example:
esc_html() esc_attr() esc_url()
The appropriate escaping function depends on the output context.
Nonces for Admin Actions
Use WordPress nonces for actions that modify data.
For example:
Admin Clicks "Clear Cache" ↓ Nonce Check ↓ Capability Check ↓ Validate ↓ Action
A nonce is not a replacement for a capability check.
Use both where appropriate.
AJAX in WordPress Admin
AJAX can make dashboards feel more responsive.
For example:
Dashboard ↓ Refresh Analytics ↓ AJAX Request ↓ Server ↓ New Data
The complete admin page does not need to reload.
REST API in Plugin Dashboards
REST APIs can be useful for modern interfaces.
For example:
/wp-json/my-plugin/v1/stats /wp-json/my-plugin/v1/settings /wp-json/my-plugin/v1/logs
Each endpoint should use explicit permission checks.
AJAX vs REST API
AJAX
Useful for traditional WordPress admin interactions.
REST API
Useful for:
React
Modern JavaScript
External applications
Mobile apps
Headless interfaces
Choose based on the architecture rather than trend.
Build the Dashboard With React
For a complex admin interface, React can provide:
Interactive components
Dynamic tables
Filters
Charts
Real-time updates
Complex workflows
WordPress provides APIs and packages that can support React-based admin interfaces.
Do Not Use React Everywhere
A simple settings page does not need a full JavaScript application.
For example:
Simple Settings → PHP + WordPress Settings API Complex Analytics → React / REST API
Use the simplest technology that fits the screen.
Properly Enqueue Admin CSS
Only load plugin admin assets on plugin screens.
For example:
Plugin Dashboard → Load plugin-dashboard.css WordPress Posts Screen → Do not load plugin dashboard CSS
This reduces conflicts and unnecessary overhead.
Properly Enqueue Admin JavaScript
Load JavaScript only where needed.
Avoid injecting large scripts into every WordPress admin page.
This improves:
Performance
Compatibility
Maintainability
Prevent CSS Conflicts
Avoid generic selectors such as:
.button {} .card {} .header {}
These can conflict with other admin components.
Prefer plugin-specific classes:
.kdr-dashboard-card {} .kdr-dashboard-header {}
Use a unique prefix appropriate to the plugin.
Use WordPress Admin UI Patterns
The WordPress admin already has familiar UI patterns for:
Tables
Buttons
Notices
Forms
Tabs
Pagination
Using familiar patterns can reduce the learning curve for users.
Dashboard Cards
Cards can summarize important information:
┌───────────────┐ │ Orders │ │ 1,248 │ └───────────────┘
Don't turn every piece of information into a card.
Cards are most useful for high-level summaries.
Tables
Tables work well for:
Orders
Users
Logs
Products
API requests
Reports
A table should support:
Sorting
Filtering
Pagination
Search
Useful columns
Large Data Tables
Don't load thousands of records into the browser at once.
Use:
Search ↓ Server Query ↓ Pagination ↓ Results
Server-side pagination is important for large datasets.
Filters
Useful filters may include:
Date Status Type User Product Category
Filters should solve a real navigation problem.
Avoid adding a filter for every database field.
Search
A dashboard may need search across:
Logs
Orders
Products
Customers
Tickets
Use efficient database queries and indexing where appropriate.
Dashboard Charts
Charts can help visualize:
Revenue
Orders
Users
Conversions
Traffic
API usage
For example:
Revenue │ │ ╭──╮ │ ╭───╯ ╰──╮ │──╯ ╰── └────────────────
The chart should communicate a clear story.
Don't Add Charts Just to Look Advanced
A chart should answer a useful question.
For example:
"How have monthly orders changed?"
is useful.
A decorative graph that provides no actionable information is not.
Date Range Controls
Analytics dashboards often need:
Today 7 Days 30 Days This Month Custom Range
The date range should be applied consistently to all relevant metrics.
Real-Time Data vs Cached Data
Not every dashboard metric needs real-time calculation.
For example:
System Status → Real Time Monthly Analytics → Cached Historical Report → Precomputed
This can improve performance.
Cache Expensive Analytics
If a query takes several seconds:
Calculate ↓ Cache ↓ Reuse
Refresh cached values periodically.
Dashboard REST Endpoints and Permissions
A stats endpoint should verify:
Authenticated User ↓ Required Capability ↓ Allowed Data ↓ Response
Never expose private analytics simply because the endpoint URL is known.
Protect Customer Data
Dashboard widgets may contain:
Customer names
Emails
Orders
Revenue
Support information
Only display data the current user is authorized to see.
Multi-Role Dashboards
Different users may need different dashboard views.
For example:
Administrator → Full Dashboard Manager → Analytics + Reports Support → Tickets + Customer Information Editor → Content Tools
Don't duplicate the entire dashboard when role-based components can be reused.
Role-Based Widgets
A widget can check capabilities:
Can View Analytics? → Show Analytics Cannot? → Hide Widget
But hiding a widget is not a security mechanism.
The underlying data endpoint must enforce permissions as well.
Dashboard Tabs
A complex plugin may use tabs such as:
Overview | Analytics | Settings | Tools
Tabs should group related functions.
Don't create ten tabs for ten settings.
Wizard-Based Setup
New plugins may benefit from an onboarding wizard:
Welcome ↓ Connect API ↓ Choose Settings ↓ Test Connection ↓ Finish
This reduces setup friction.
Dashboard Onboarding
After installation, show:
Setup Progress ██████░░░░ 60%
with clear next actions.
The dashboard should not become an obstacle.
Connection Status Widget
For plugins using external APIs:
API Connection ● Connected Last Sync: 10:42 AM [Reconnect]
Status should reflect an actual connection test or recent successful operation.
API Usage Widget
A plugin using an external AI or API service might display:
API Usage Requests: 1,820 Monthly Limit: 5,000
The exact calculation should be based on the service's authoritative usage data where available.
Logs Screen
A plugin dashboard may expose logs such as:
Time Event Status User Message
Logs can help diagnose:
API failures
Scheduled jobs
Sync errors
Authentication problems
Never Log Secrets
Do not write:
API keys
Passwords
Access tokens
Session credentials
into plugin logs.
Logs should contain enough information for troubleshooting without becoming a security liability.
Export Reports
A plugin may allow users to export:
CSV
JSON
The export action must verify permissions.
For large reports, background generation may be more appropriate.
Import Tools
If the plugin supports imports:
Upload ↓ Validate ↓ Preview ↓ Confirm ↓ Import
Never trust uploaded files blindly.
Bulk Actions
Admin tables may include:
Select ↓ Bulk Action ↓ Confirm ↓ Process
Dangerous bulk operations should require confirmation.
Confirm Destructive Actions
For example:
Delete 58 Records? This action cannot be undone. [Cancel] [Confirm]
The confirmation should explain the consequence.
Undo and Rollback
Where possible, prefer reversible actions.
For example:
Disable
may be safer than:
Delete Permanently
Maintain backups for important data.
Dashboard Accessibility
A professional dashboard should support:
Keyboard navigation
Visible focus
Screen readers
Accessible labels
Logical headings
Adequate contrast
Clear error messages
Do not sacrifice accessibility for visual effects.
Responsive Admin Interfaces
Although WordPress admin is desktop-oriented, plugin interfaces should still behave reasonably on smaller screens where applicable.
Check:
Tables
Forms
Charts
Tabs
Buttons
Avoid horizontally overflowing critical controls.
Dashboard Internationalization
All user-facing strings should be translation-ready.
For example:
__( 'Dashboard', 'your-text-domain' );
Follow the plugin's text domain and localization architecture consistently.
Admin Dashboard Security Checklist
Every dashboard action should consider:
Authentication ↓ Capability ↓ Nonce ↓ Input Validation ↓ Business Rule ↓ Database / API
For REST endpoints, use the appropriate authentication and permission mechanisms for the request.
Database Queries
Use WordPress database APIs safely.
Avoid building SQL queries by concatenating raw user input.
Use appropriate preparation and validation.
Dashboard Performance
Avoid loading:
Entire customer tables
Entire order datasets
Huge logs
Unbounded analytics queries
Instead use:
Pagination Filtering Caching Indexes Background Jobs
Background Jobs
Long tasks such as:
Importing 100,000 records
Generating analytics
Synchronizing products
Rebuilding indexes
should generally run outside the immediate browser request.
A job workflow can be:
Start ↓ Queue ↓ Process ↓ Progress ↓ Complete
Dashboard Notifications
A plugin can provide actionable alerts:
⚠ API connection expired Action: Reconnect
Notifications should help users solve problems.
Don't Overload the Dashboard
If every widget becomes a warning, users stop noticing important alerts.
Prioritize:
Critical ↓ Important ↓ Informational
Dashboard Help and Documentation
Each complex feature can provide:
Need Help? [Read Documentation]
Contextual help can reduce support requests.
Support Links
A plugin dashboard can include:
Documentation
FAQ
Support
Changelog
Troubleshooting
These links should point to actual resources and remain current.
Plugin Dashboard for AI Products
An AI-powered plugin might provide:
AI Usage Requests Models Features Credits Errors
The dashboard can become the control center for AI usage.
Example AI Plugin Dashboard
AI Overview Requests Today: 142 Monthly Usage: 2,480 Provider: Connected Features: ✓ Content Assistant ✓ AI Search ✓ Recommendations Recent Activity: 3 Successful 1 Failed
Use actual metrics rather than decorative placeholders.
Dashboard for WooCommerce Plugins
A WooCommerce plugin may display:
Orders Revenue Products Conversions Returns Top Products
The underlying data should come from authoritative WooCommerce records.
Plugin Empty States
When no data exists, don't display a blank screen.
For example:
No Reports Yet Run your first synchronization to generate analytics. [Run Sync]
Empty states should explain the next action.
Loading States
For AJAX or REST operations:
Loading...
For longer tasks:
Generating Report... Progress: 64%
This gives users confidence that the action is working.
Error States
An error should explain:
What happened? Why? What can the user do?
For example:
"The external API rejected the request. Check your API credentials and try the connection test again."
Avoid exposing internal stack traces.
Dashboard Design System
A reusable plugin dashboard system can provide:
Header Cards Tables Charts Forms Notices Modals Tabs Empty States Loading States
This can accelerate development across multiple plugins.
Dashboard Development Workflow
A practical development process is:
Requirements ↓ Information Architecture ↓ Wireframe ↓ Capability Model ↓ Backend APIs ↓ Admin UI ↓ Validation ↓ Security Review ↓ Performance Testing
Start with the user workflow rather than the visual styling.
Dashboard Testing
Test:
Functional
Menu navigation
Settings
Tables
Filters
Charts
AJAX
REST endpoints
Security
Unauthorized access
Capability bypass
Nonce validation
ID manipulation
Data exposure
Compatibility
WordPress versions
PHP versions
Other plugins
Themes
Test With Different Roles
At minimum, test:
Administrator Editor Custom Plugin Role Unauthorized User
Each should see only what the capability model permits.
Test Large Data Volumes
Test with:
10 Records 1,000 Records 100,000 Records
The dashboard should degrade gracefully rather than becoming unusable.
Common Custom Dashboard Mistakes
One Giant Settings Page
Users cannot find anything.
Missing Capability Checks
Unauthorized users can access data.
No Nonces
Admin actions become more vulnerable.
Loading Assets Everywhere
Admin performance suffers.
Generic CSS Selectors
Plugin styles conflict with WordPress or other plugins.
Huge Database Queries
Dashboard becomes slow.
Too Many Charts
Users cannot identify useful information.
No Empty States
New users see confusing blank screens.
No Error Handling
Failures appear mysterious.
No Documentation Links
Users cannot solve configuration problems.
Best Practices for WordPress Plugin Admin Dashboards
A professional dashboard should:
Group related features logically.
Use appropriate capabilities.
Protect state-changing actions with nonces where applicable.
Validate and sanitize inputs.
Escape outputs.
Load assets only on plugin screens.
Use server-side pagination for large datasets.
Cache expensive analytics.
Use queues for long-running work.
Provide useful loading and error states.
Support keyboard navigation and accessibility.
Keep interface strings translation-ready.
Provide contextual documentation.
Avoid unnecessary promotional clutter.
Maintain audit logs where appropriate.
Professional WordPress Plugin Dashboard Architecture
A scalable architecture can look like:
WordPress Admin │ ▼ Plugin Dashboard UI │ ┌───────────┼───────────┐ ▼ ▼ ▼ Forms Tables Charts │ │ │ └───────────┼───────────┘ ▼ REST / AJAX │ Permission Layer │ Business Services ┌───────────┼───────────┐ ▼ ▼ ▼ Database WooCommerce External APIs │ ▼ Cache / Queue
The UI should remain separate from business logic.
Why choose ThemeKaddora?
ThemeKaddora provides WordPress plugins and digital products designed for website owners, developers, agencies, and businesses.
Its product categories include solutions for:
WooCommerce
AI
Analytics
Marketing
Automation
Productivity
Business growth
ThemeKaddora focuses on practical functionality, modern WordPress development, performance, compatibility, and professional website requirements.
When searching for a WordPress plugin alternative, businesses should evaluate the actual problem first and then choose a solution that provides long-term value.
Conclusion
A custom WordPress plugin admin dashboard can turn a technically powerful plugin into a much easier product to manage.
The foundation is:
Clear Information Architecture
→ Secure Permissions
→ Organized Settings
→ Useful Data
→ Fast Interactions
→ Actionable Feedback
The best dashboards do not try to show everything at once.
They answer three questions quickly:
What is happening?
What needs attention?
What should I do next?
The strongest WordPress admin dashboard is one that makes complex plugin functionality feel organized, understandable, secure, and manageable.
Frequently Asked Questions
What is a WordPress plugin admin dashboard?
A plugin admin dashboard is a dedicated WordPress administration interface where users can view plugin information, configure settings, monitor data, run tools, and manage features.
Can I create a custom admin menu for my plugin?
Yes. WordPress provides admin-menu APIs for creating top-level and submenu pages.
Should every plugin have a custom dashboard?
Not necessarily. Small plugins may only need a settings page. Complex plugins benefit more from centralized dashboards.
What capability should an admin dashboard use?
The capability should match the sensitivity of the screen. Don't automatically give every screen access to users with the highest administrator capability.
Can plugin dashboards use React?
Yes. React can be useful for complex, highly interactive interfaces, particularly when combined with WordPress REST APIs.
Can a dashboard use AJAX?
Yes. AJAX can update portions of the interface without requiring a full page reload.
Can a WordPress plugin dashboard use REST APIs?
Yes. REST APIs are useful for modern JavaScript interfaces, React dashboards, external integrations, and mobile applications.
How do I secure an admin dashboard?
Use authentication, capability checks, nonces for appropriate state-changing actions, input validation, output escaping, secure APIs, and strict data-access controls.
Do I need nonces and capability checks together?
In many WordPress administrative actions, yes. They address different security concerns: capabilities determine authorization, while nonces help protect requests against certain unwanted or forged actions.
How can I make a plugin dashboard fast?
Load assets only where needed, paginate large datasets, cache expensive calculations, optimize database queries, and move long-running tasks into background processing.
Can I add charts to a WordPress plugin dashboard?
Yes. Analytics dashboards can display charts for sales, users, revenue, conversions, API usage, or other useful metrics.
Why choose Themekaddora?
Themekaddora provides lightweight, responsive, SEO-friendly WordPress themes with fast performance, WooCommerce compatibility, flexible customization, accessibility-conscious design, modern templates, regular updates, and professional support—providing a strong foundation for businesses building digital products and product-focused websites.
Comments (0)